Immigrants from Guatemala vs Immigrants from Middle Africa 6th Grade
COMPARE
Immigrants from Guatemala
Immigrants from Middle Africa
6th Grade
6th Grade Comparison
Immigrants from Guatemala
Immigrants from Middle Africa
93.9%
6TH GRADE
0.0/ 100
METRIC RATING
344th/ 347
METRIC RANK
96.5%
6TH GRADE
0.8/ 100
METRIC RATING
250th/ 347
METRIC RANK
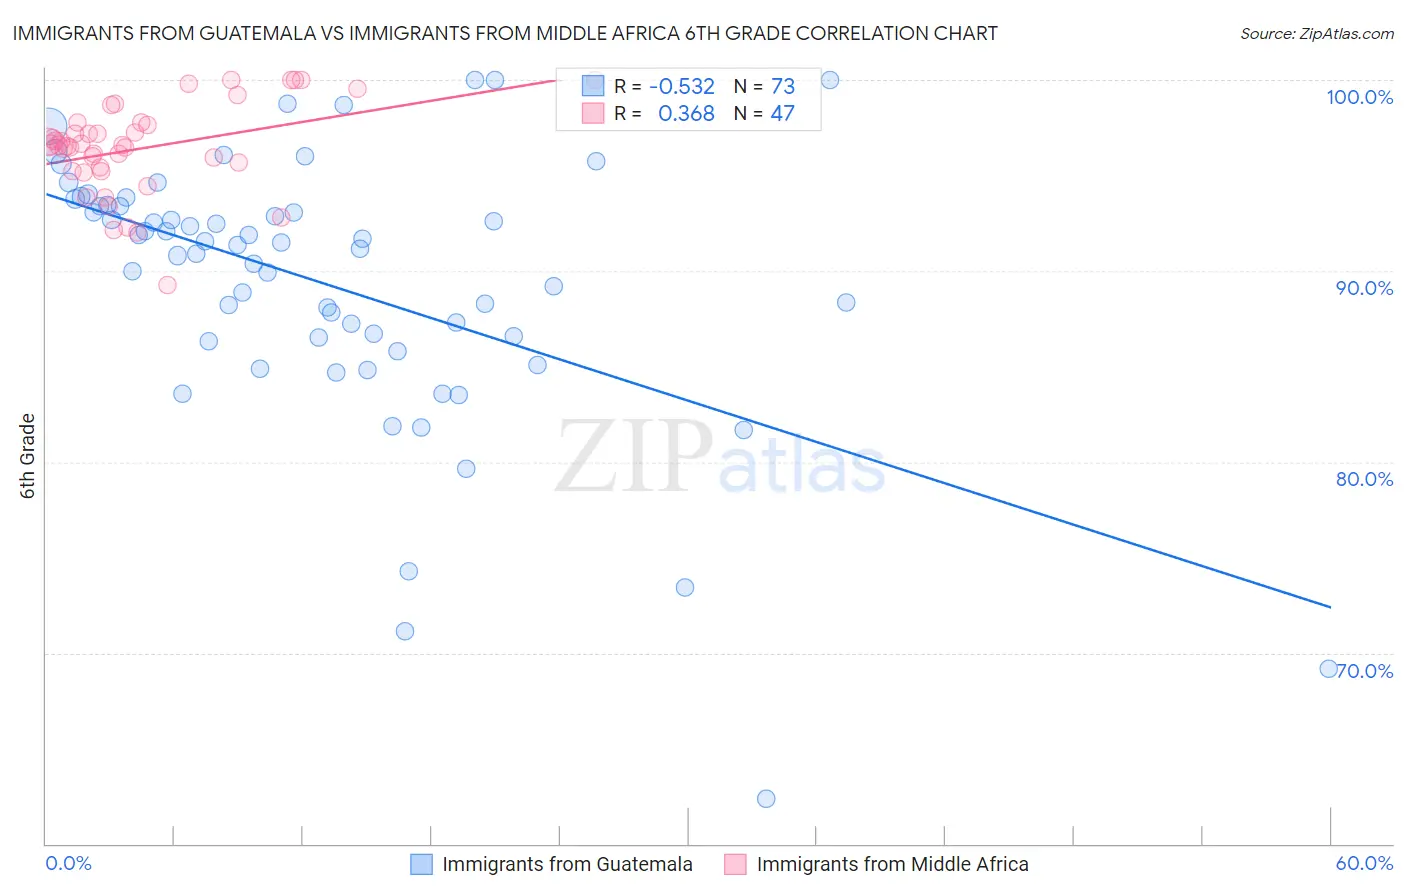
Immigrants from Guatemala vs Immigrants from Middle Africa 6th Grade Correlation Chart
The statistical analysis conducted on geographies consisting of 377,285,993 people shows a substantial negative correlation between the proportion of Immigrants from Guatemala and percentage of population with at least 6th grade education in the United States with a correlation coefficient (R) of -0.532 and weighted average of 93.9%. Similarly, the statistical analysis conducted on geographies consisting of 202,721,852 people shows a mild positive correlation between the proportion of Immigrants from Middle Africa and percentage of population with at least 6th grade education in the United States with a correlation coefficient (R) of 0.368 and weighted average of 96.5%, a difference of 2.7%.
6th Grade Correlation Summary
| Measurement | Immigrants from Guatemala | Immigrants from Middle Africa |
| Minimum | 62.4% | 89.2% |
| Maximum | 100.0% | 100.0% |
| Range | 37.6% | 10.8% |
| Mean | 89.3% | 96.4% |
| Median | 91.4% | 96.6% |
| Interquartile 25% (IQ1) | 86.4% | 95.3% |
| Interquartile 75% (IQ3) | 93.4% | 97.8% |
| Interquartile Range (IQR) | 7.0% | 2.5% |
| Standard Deviation (Sample) | 7.1% | 2.4% |
| Standard Deviation (Population) | 7.0% | 2.4% |
Similar Demographics by 6th Grade
Demographics Similar to Immigrants from Guatemala by 6th Grade
In terms of 6th grade, the demographic groups most similar to Immigrants from Guatemala are Immigrants from Mexico (93.9%, a difference of 0.0%), Salvadoran (93.9%, a difference of 0.0%), Immigrants from Central America (94.0%, a difference of 0.060%), Immigrants from Yemen (94.1%, a difference of 0.17%), and Guatemalan (94.2%, a difference of 0.28%).
| Demographics | Rating | Rank | 6th Grade |
| Immigrants | Latin America | 0.0 /100 | #333 | Tragic 94.7% |
| Immigrants | Azores | 0.0 /100 | #334 | Tragic 94.7% |
| Mexicans | 0.0 /100 | #335 | Tragic 94.6% |
| Immigrants | Dominican Republic | 0.0 /100 | #336 | Tragic 94.6% |
| Central Americans | 0.0 /100 | #337 | Tragic 94.5% |
| Immigrants | Cabo Verde | 0.0 /100 | #338 | Tragic 94.4% |
| Yakama | 0.0 /100 | #339 | Tragic 94.3% |
| Guatemalans | 0.0 /100 | #340 | Tragic 94.2% |
| Immigrants | Yemen | 0.0 /100 | #341 | Tragic 94.1% |
| Immigrants | Central America | 0.0 /100 | #342 | Tragic 94.0% |
| Immigrants | Mexico | 0.0 /100 | #343 | Tragic 93.9% |
| Immigrants | Guatemala | 0.0 /100 | #344 | Tragic 93.9% |
| Salvadorans | 0.0 /100 | #345 | Tragic 93.9% |
| Spanish American Indians | 0.0 /100 | #346 | Tragic 93.6% |
| Immigrants | El Salvador | 0.0 /100 | #347 | Tragic 93.6% |
Demographics Similar to Immigrants from Middle Africa by 6th Grade
In terms of 6th grade, the demographic groups most similar to Immigrants from Middle Africa are Tohono O'odham (96.5%, a difference of 0.020%), Colombian (96.5%, a difference of 0.020%), Immigrants from Senegal (96.5%, a difference of 0.020%), Immigrants from Uruguay (96.5%, a difference of 0.020%), and Bolivian (96.5%, a difference of 0.030%).
| Demographics | Rating | Rank | 6th Grade |
| Immigrants | Liberia | 1.6 /100 | #243 | Tragic 96.6% |
| Ethiopians | 1.5 /100 | #244 | Tragic 96.6% |
| Immigrants | Costa Rica | 1.3 /100 | #245 | Tragic 96.6% |
| Immigrants | Africa | 1.3 /100 | #246 | Tragic 96.6% |
| Bolivians | 1.0 /100 | #247 | Tragic 96.5% |
| Tohono O'odham | 1.0 /100 | #248 | Tragic 96.5% |
| Colombians | 0.9 /100 | #249 | Tragic 96.5% |
| Immigrants | Middle Africa | 0.8 /100 | #250 | Tragic 96.5% |
| Immigrants | Senegal | 0.7 /100 | #251 | Tragic 96.5% |
| Immigrants | Uruguay | 0.6 /100 | #252 | Tragic 96.5% |
| Jamaicans | 0.6 /100 | #253 | Tragic 96.5% |
| Immigrants | Ethiopia | 0.6 /100 | #254 | Tragic 96.5% |
| Immigrants | Congo | 0.6 /100 | #255 | Tragic 96.5% |
| U.S. Virgin Islanders | 0.5 /100 | #256 | Tragic 96.5% |
| Taiwanese | 0.5 /100 | #257 | Tragic 96.5% |