Immigrants from Grenada vs Hmong Nursery School
COMPARE
Immigrants from Grenada
Hmong
Nursery School
Nursery School Comparison
Immigrants from Grenada
Hmong
97.3%
NURSERY SCHOOL
0.0/ 100
METRIC RATING
294th/ 347
METRIC RANK
98.1%
NURSERY SCHOOL
75.7/ 100
METRIC RATING
147th/ 347
METRIC RANK
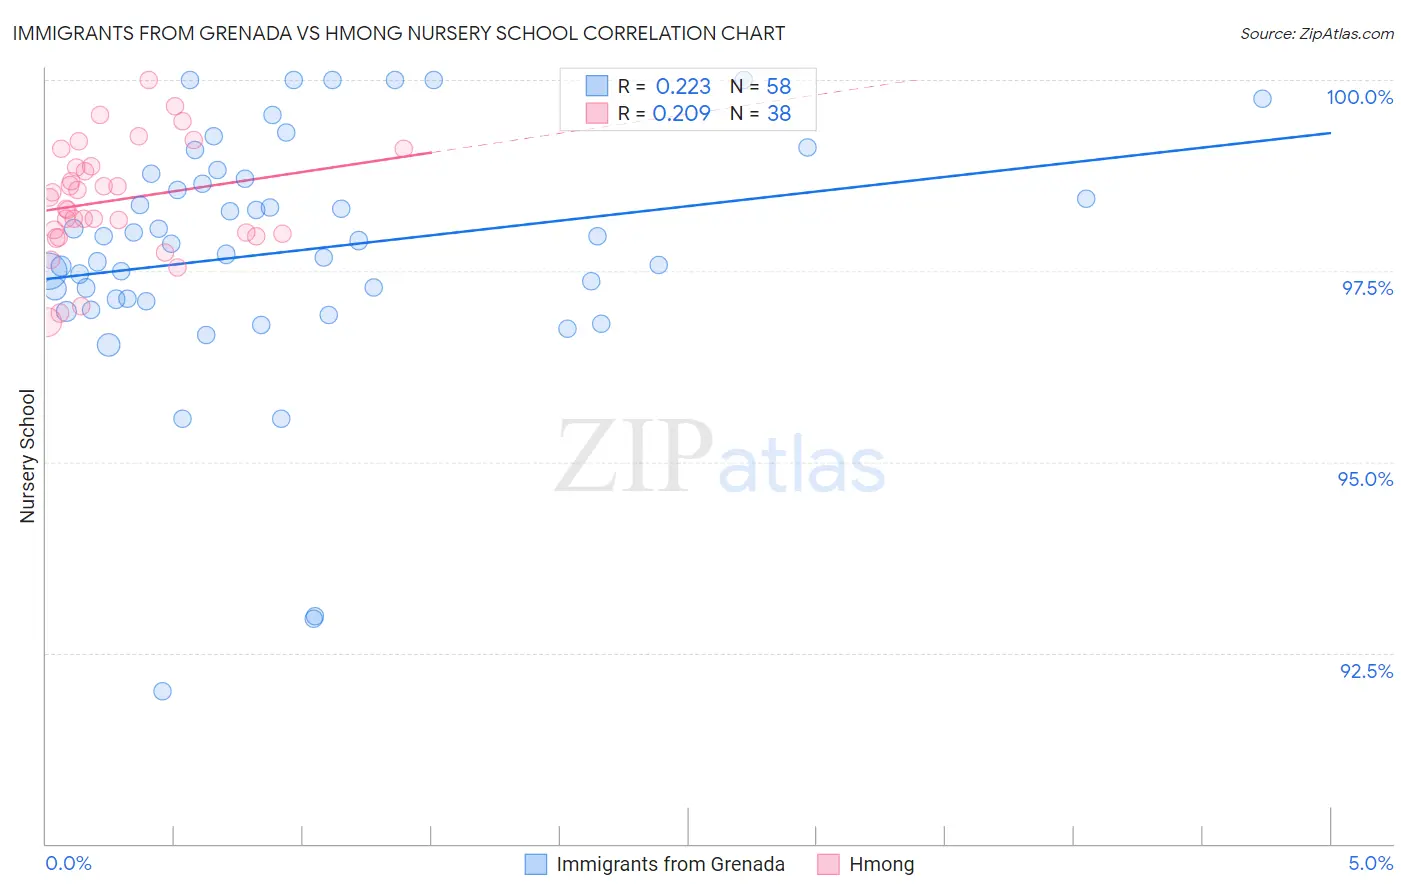
Immigrants from Grenada vs Hmong Nursery School Correlation Chart
The statistical analysis conducted on geographies consisting of 67,200,336 people shows a weak positive correlation between the proportion of Immigrants from Grenada and percentage of population with at least nursery school education in the United States with a correlation coefficient (R) of 0.223 and weighted average of 97.3%. Similarly, the statistical analysis conducted on geographies consisting of 24,672,093 people shows a weak positive correlation between the proportion of Hmong and percentage of population with at least nursery school education in the United States with a correlation coefficient (R) of 0.209 and weighted average of 98.1%, a difference of 0.83%.
Nursery School Correlation Summary
| Measurement | Immigrants from Grenada | Hmong |
| Minimum | 92.0% | 96.8% |
| Maximum | 100.0% | 100.0% |
| Range | 8.0% | 3.2% |
| Mean | 97.8% | 98.4% |
| Median | 97.9% | 98.4% |
| Interquartile 25% (IQ1) | 97.1% | 98.0% |
| Interquartile 75% (IQ3) | 98.7% | 98.9% |
| Interquartile Range (IQR) | 1.6% | 0.87% |
| Standard Deviation (Sample) | 1.6% | 0.73% |
| Standard Deviation (Population) | 1.6% | 0.72% |
Similar Demographics by Nursery School
Demographics Similar to Immigrants from Grenada by Nursery School
In terms of nursery school, the demographic groups most similar to Immigrants from Grenada are Malaysian (97.3%, a difference of 0.010%), Immigrants (97.2%, a difference of 0.010%), Houma (97.3%, a difference of 0.020%), Immigrants from Eritrea (97.2%, a difference of 0.020%), and British West Indian (97.3%, a difference of 0.040%).
| Demographics | Rating | Rank | Nursery School |
| Immigrants | Hong Kong | 0.0 /100 | #287 | Tragic 97.4% |
| Immigrants | Thailand | 0.0 /100 | #288 | Tragic 97.3% |
| Immigrants | St. Vincent and the Grenadines | 0.0 /100 | #289 | Tragic 97.3% |
| Immigrants | Afghanistan | 0.0 /100 | #290 | Tragic 97.3% |
| British West Indians | 0.0 /100 | #291 | Tragic 97.3% |
| Houma | 0.0 /100 | #292 | Tragic 97.3% |
| Malaysians | 0.0 /100 | #293 | Tragic 97.3% |
| Immigrants | Grenada | 0.0 /100 | #294 | Tragic 97.3% |
| Immigrants | Immigrants | 0.0 /100 | #295 | Tragic 97.2% |
| Immigrants | Eritrea | 0.0 /100 | #296 | Tragic 97.2% |
| Immigrants | Cuba | 0.0 /100 | #297 | Tragic 97.2% |
| Central American Indians | 0.0 /100 | #298 | Tragic 97.2% |
| Immigrants | Dominica | 0.0 /100 | #299 | Tragic 97.2% |
| Haitians | 0.0 /100 | #300 | Tragic 97.2% |
| Immigrants | South Eastern Asia | 0.0 /100 | #301 | Tragic 97.1% |
Demographics Similar to Hmong by Nursery School
In terms of nursery school, the demographic groups most similar to Hmong are Immigrants from Greece (98.1%, a difference of 0.0%), Immigrants from Israel (98.1%, a difference of 0.010%), Filipino (98.1%, a difference of 0.010%), Apache (98.1%, a difference of 0.010%), and Jordanian (98.1%, a difference of 0.010%).
| Demographics | Rating | Rank | Nursery School |
| Palestinians | 83.7 /100 | #140 | Excellent 98.1% |
| Immigrants | Turkey | 83.0 /100 | #141 | Excellent 98.1% |
| Burmese | 81.7 /100 | #142 | Excellent 98.1% |
| Marshallese | 81.2 /100 | #143 | Excellent 98.1% |
| Alsatians | 80.3 /100 | #144 | Excellent 98.1% |
| Immigrants | Israel | 78.5 /100 | #145 | Good 98.1% |
| Filipinos | 78.5 /100 | #146 | Good 98.1% |
| Hmong | 75.7 /100 | #147 | Good 98.1% |
| Immigrants | Greece | 75.4 /100 | #148 | Good 98.1% |
| Apache | 73.2 /100 | #149 | Good 98.1% |
| Jordanians | 72.9 /100 | #150 | Good 98.1% |
| Soviet Union | 71.6 /100 | #151 | Good 98.0% |
| Dutch West Indians | 70.2 /100 | #152 | Good 98.0% |
| Immigrants | Moldova | 69.6 /100 | #153 | Good 98.0% |
| Immigrants | Iran | 68.7 /100 | #154 | Good 98.0% |