Immigrants from Laos vs Hmong Nursery School
COMPARE
Immigrants from Laos
Hmong
Nursery School
Nursery School Comparison
Immigrants from Laos
Hmong
96.9%
NURSERY SCHOOL
0.0/ 100
METRIC RATING
319th/ 347
METRIC RANK
98.1%
NURSERY SCHOOL
75.7/ 100
METRIC RATING
147th/ 347
METRIC RANK
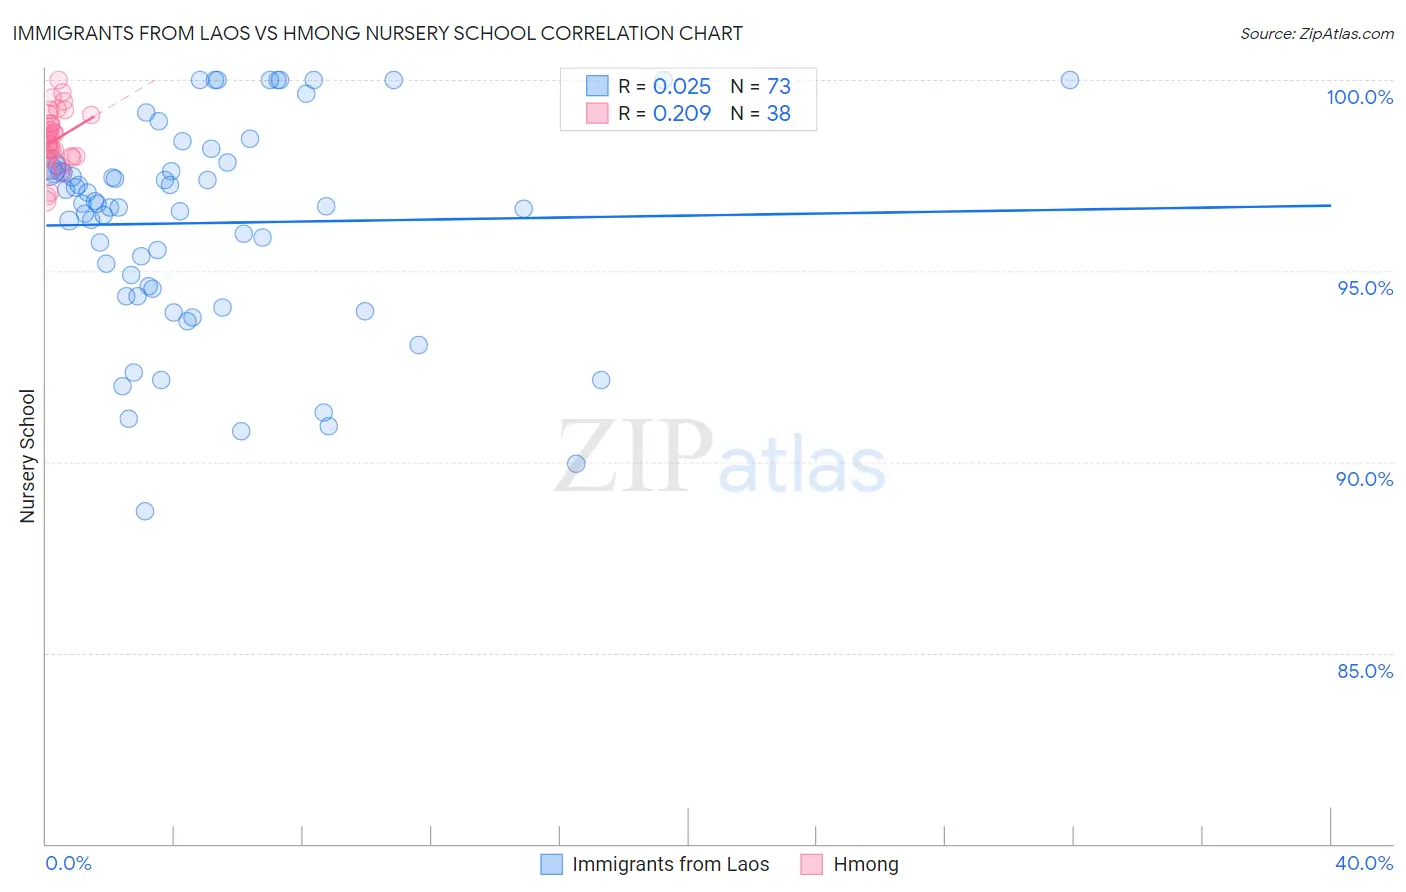
Immigrants from Laos vs Hmong Nursery School Correlation Chart
The statistical analysis conducted on geographies consisting of 201,453,273 people shows no correlation between the proportion of Immigrants from Laos and percentage of population with at least nursery school education in the United States with a correlation coefficient (R) of 0.025 and weighted average of 96.9%. Similarly, the statistical analysis conducted on geographies consisting of 24,672,093 people shows a weak positive correlation between the proportion of Hmong and percentage of population with at least nursery school education in the United States with a correlation coefficient (R) of 0.209 and weighted average of 98.1%, a difference of 1.2%.
Nursery School Correlation Summary
| Measurement | Immigrants from Laos | Hmong |
| Minimum | 88.7% | 96.8% |
| Maximum | 100.0% | 100.0% |
| Range | 11.3% | 3.2% |
| Mean | 96.3% | 98.4% |
| Median | 96.8% | 98.4% |
| Interquartile 25% (IQ1) | 94.4% | 98.0% |
| Interquartile 75% (IQ3) | 97.8% | 98.9% |
| Interquartile Range (IQR) | 3.3% | 0.87% |
| Standard Deviation (Sample) | 2.7% | 0.73% |
| Standard Deviation (Population) | 2.7% | 0.72% |
Similar Demographics by Nursery School
Demographics Similar to Immigrants from Laos by Nursery School
In terms of nursery school, the demographic groups most similar to Immigrants from Laos are Immigrants from Burma/Myanmar (96.9%, a difference of 0.0%), Immigrants from Bangladesh (96.9%, a difference of 0.010%), Immigrants from Guyana (96.9%, a difference of 0.020%), Mexican American Indian (96.9%, a difference of 0.020%), and Immigrants from Honduras (96.9%, a difference of 0.030%).
| Demographics | Rating | Rank | Nursery School |
| Sri Lankans | 0.0 /100 | #312 | Tragic 97.0% |
| Hondurans | 0.0 /100 | #313 | Tragic 97.0% |
| Cape Verdeans | 0.0 /100 | #314 | Tragic 97.0% |
| Immigrants | Nicaragua | 0.0 /100 | #315 | Tragic 96.9% |
| Immigrants | Belize | 0.0 /100 | #316 | Tragic 96.9% |
| Immigrants | Ecuador | 0.0 /100 | #317 | Tragic 96.9% |
| Immigrants | Guyana | 0.0 /100 | #318 | Tragic 96.9% |
| Immigrants | Laos | 0.0 /100 | #319 | Tragic 96.9% |
| Immigrants | Burma/Myanmar | 0.0 /100 | #320 | Tragic 96.9% |
| Immigrants | Bangladesh | 0.0 /100 | #321 | Tragic 96.9% |
| Mexican American Indians | 0.0 /100 | #322 | Tragic 96.9% |
| Immigrants | Honduras | 0.0 /100 | #323 | Tragic 96.9% |
| Vietnamese | 0.0 /100 | #324 | Tragic 96.8% |
| Dominicans | 0.0 /100 | #325 | Tragic 96.8% |
| Indonesians | 0.0 /100 | #326 | Tragic 96.8% |
Demographics Similar to Hmong by Nursery School
In terms of nursery school, the demographic groups most similar to Hmong are Immigrants from Greece (98.1%, a difference of 0.0%), Immigrants from Israel (98.1%, a difference of 0.010%), Filipino (98.1%, a difference of 0.010%), Apache (98.1%, a difference of 0.010%), and Jordanian (98.1%, a difference of 0.010%).
| Demographics | Rating | Rank | Nursery School |
| Palestinians | 83.7 /100 | #140 | Excellent 98.1% |
| Immigrants | Turkey | 83.0 /100 | #141 | Excellent 98.1% |
| Burmese | 81.7 /100 | #142 | Excellent 98.1% |
| Marshallese | 81.2 /100 | #143 | Excellent 98.1% |
| Alsatians | 80.3 /100 | #144 | Excellent 98.1% |
| Immigrants | Israel | 78.5 /100 | #145 | Good 98.1% |
| Filipinos | 78.5 /100 | #146 | Good 98.1% |
| Hmong | 75.7 /100 | #147 | Good 98.1% |
| Immigrants | Greece | 75.4 /100 | #148 | Good 98.1% |
| Apache | 73.2 /100 | #149 | Good 98.1% |
| Jordanians | 72.9 /100 | #150 | Good 98.1% |
| Soviet Union | 71.6 /100 | #151 | Good 98.0% |
| Dutch West Indians | 70.2 /100 | #152 | Good 98.0% |
| Immigrants | Moldova | 69.6 /100 | #153 | Good 98.0% |
| Immigrants | Iran | 68.7 /100 | #154 | Good 98.0% |