Immigrants from Grenada vs Colville Nursery School
COMPARE
Immigrants from Grenada
Colville
Nursery School
Nursery School Comparison
Immigrants from Grenada
Colville
97.3%
NURSERY SCHOOL
0.0/ 100
METRIC RATING
294th/ 347
METRIC RANK
98.3%
NURSERY SCHOOL
98.2/ 100
METRIC RATING
99th/ 347
METRIC RANK
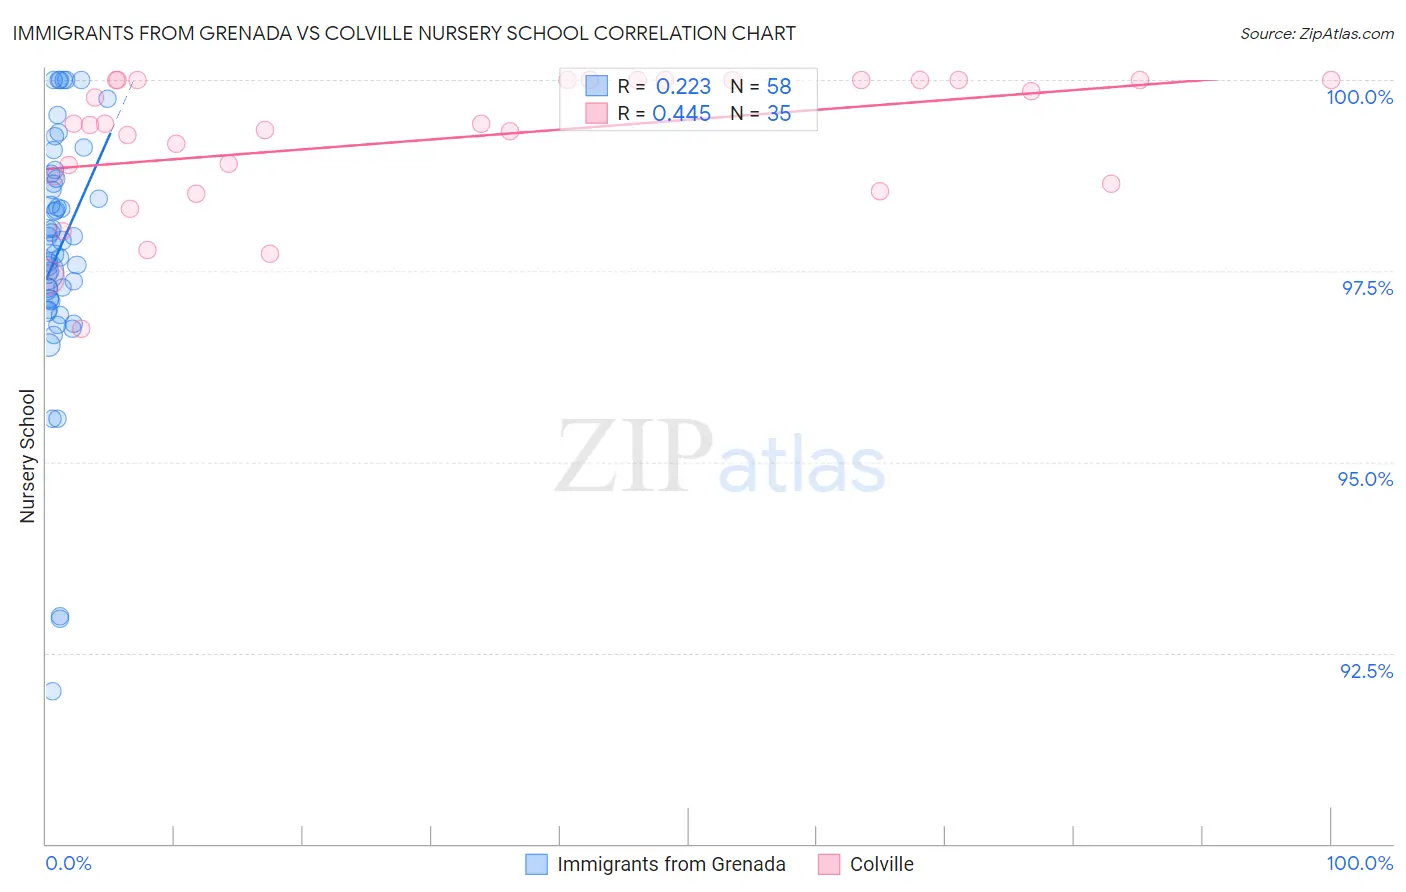
Immigrants from Grenada vs Colville Nursery School Correlation Chart
The statistical analysis conducted on geographies consisting of 67,200,336 people shows a weak positive correlation between the proportion of Immigrants from Grenada and percentage of population with at least nursery school education in the United States with a correlation coefficient (R) of 0.223 and weighted average of 97.3%. Similarly, the statistical analysis conducted on geographies consisting of 34,687,839 people shows a moderate positive correlation between the proportion of Colville and percentage of population with at least nursery school education in the United States with a correlation coefficient (R) of 0.445 and weighted average of 98.3%, a difference of 1.1%.
Nursery School Correlation Summary
| Measurement | Immigrants from Grenada | Colville |
| Minimum | 92.0% | 96.7% |
| Maximum | 100.0% | 100.0% |
| Range | 8.0% | 3.3% |
| Mean | 97.8% | 99.2% |
| Median | 97.9% | 99.4% |
| Interquartile 25% (IQ1) | 97.1% | 98.6% |
| Interquartile 75% (IQ3) | 98.7% | 100.0% |
| Interquartile Range (IQR) | 1.6% | 1.4% |
| Standard Deviation (Sample) | 1.6% | 0.88% |
| Standard Deviation (Population) | 1.6% | 0.87% |
Similar Demographics by Nursery School
Demographics Similar to Immigrants from Grenada by Nursery School
In terms of nursery school, the demographic groups most similar to Immigrants from Grenada are Malaysian (97.3%, a difference of 0.010%), Immigrants (97.2%, a difference of 0.010%), Houma (97.3%, a difference of 0.020%), Immigrants from Eritrea (97.2%, a difference of 0.020%), and British West Indian (97.3%, a difference of 0.040%).
| Demographics | Rating | Rank | Nursery School |
| Immigrants | Hong Kong | 0.0 /100 | #287 | Tragic 97.4% |
| Immigrants | Thailand | 0.0 /100 | #288 | Tragic 97.3% |
| Immigrants | St. Vincent and the Grenadines | 0.0 /100 | #289 | Tragic 97.3% |
| Immigrants | Afghanistan | 0.0 /100 | #290 | Tragic 97.3% |
| British West Indians | 0.0 /100 | #291 | Tragic 97.3% |
| Houma | 0.0 /100 | #292 | Tragic 97.3% |
| Malaysians | 0.0 /100 | #293 | Tragic 97.3% |
| Immigrants | Grenada | 0.0 /100 | #294 | Tragic 97.3% |
| Immigrants | Immigrants | 0.0 /100 | #295 | Tragic 97.2% |
| Immigrants | Eritrea | 0.0 /100 | #296 | Tragic 97.2% |
| Immigrants | Cuba | 0.0 /100 | #297 | Tragic 97.2% |
| Central American Indians | 0.0 /100 | #298 | Tragic 97.2% |
| Immigrants | Dominica | 0.0 /100 | #299 | Tragic 97.2% |
| Haitians | 0.0 /100 | #300 | Tragic 97.2% |
| Immigrants | South Eastern Asia | 0.0 /100 | #301 | Tragic 97.1% |
Demographics Similar to Colville by Nursery School
In terms of nursery school, the demographic groups most similar to Colville are Choctaw (98.3%, a difference of 0.0%), Cypriot (98.3%, a difference of 0.010%), Nonimmigrants (98.3%, a difference of 0.010%), Puget Sound Salish (98.3%, a difference of 0.010%), and Romanian (98.3%, a difference of 0.010%).
| Demographics | Rating | Rank | Nursery School |
| Macedonians | 98.7 /100 | #92 | Exceptional 98.3% |
| Immigrants | India | 98.7 /100 | #93 | Exceptional 98.3% |
| Immigrants | Germany | 98.6 /100 | #94 | Exceptional 98.3% |
| South Africans | 98.6 /100 | #95 | Exceptional 98.3% |
| Cypriots | 98.3 /100 | #96 | Exceptional 98.3% |
| Immigrants | Nonimmigrants | 98.3 /100 | #97 | Exceptional 98.3% |
| Choctaw | 98.3 /100 | #98 | Exceptional 98.3% |
| Colville | 98.2 /100 | #99 | Exceptional 98.3% |
| Puget Sound Salish | 98.0 /100 | #100 | Exceptional 98.3% |
| Romanians | 97.9 /100 | #101 | Exceptional 98.3% |
| Immigrants | Ireland | 97.7 /100 | #102 | Exceptional 98.3% |
| Cree | 97.7 /100 | #103 | Exceptional 98.3% |
| Bhutanese | 97.4 /100 | #104 | Exceptional 98.2% |
| Turks | 97.4 /100 | #105 | Exceptional 98.2% |
| Immigrants | Switzerland | 97.3 /100 | #106 | Exceptional 98.2% |