Immigrants from Greece vs Iroquois Master's Degree
COMPARE
Immigrants from Greece
Iroquois
Master's Degree
Master's Degree Comparison
Immigrants from Greece
Iroquois
19.0%
MASTER'S DEGREE
100.0/ 100
METRIC RATING
43rd/ 347
METRIC RANK
12.9%
MASTER'S DEGREE
1.4/ 100
METRIC RATING
247th/ 347
METRIC RANK
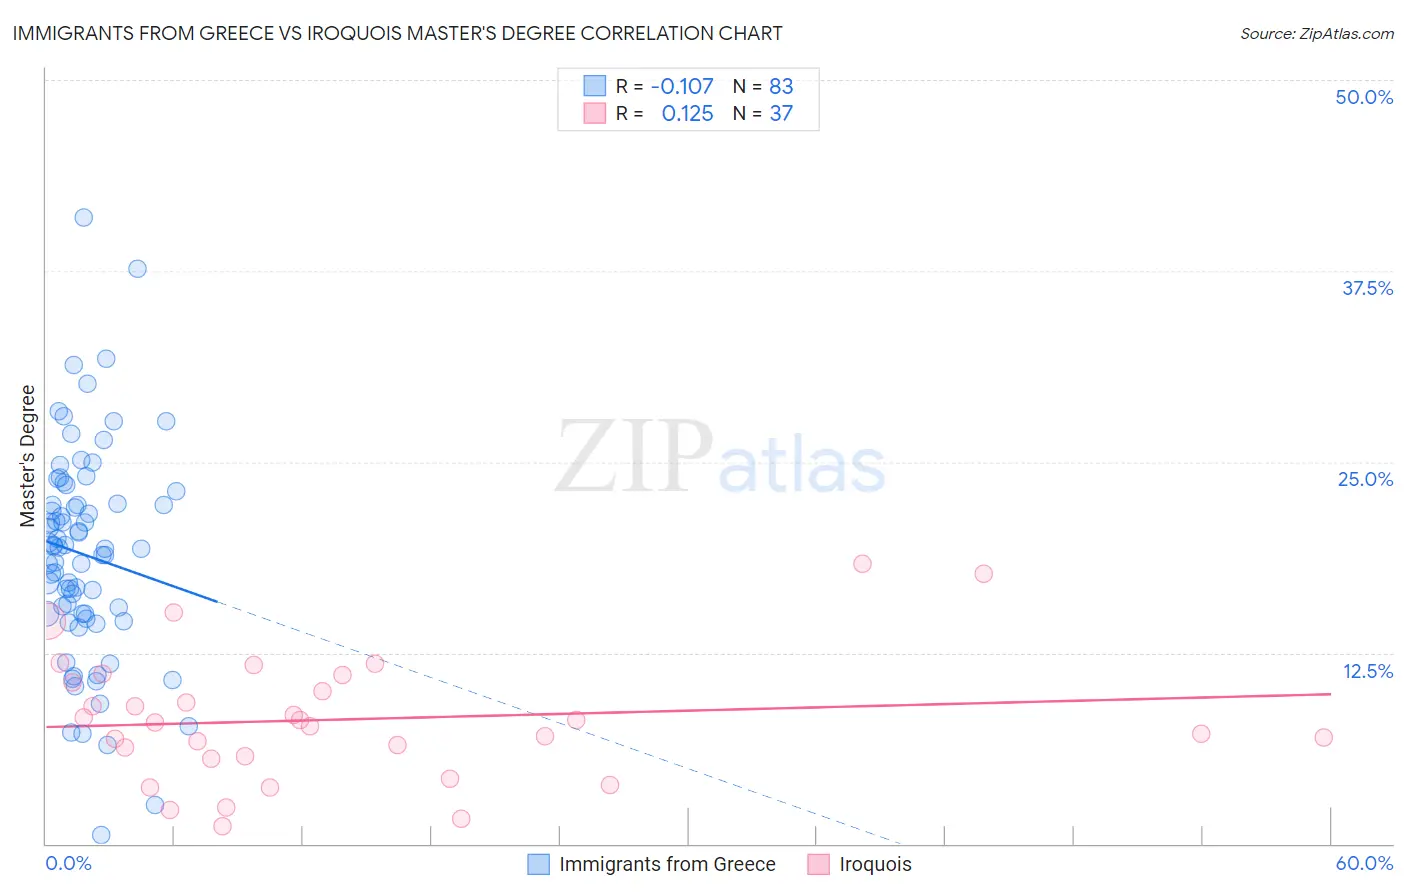
Immigrants from Greece vs Iroquois Master's Degree Correlation Chart
The statistical analysis conducted on geographies consisting of 216,873,414 people shows a poor negative correlation between the proportion of Immigrants from Greece and percentage of population with at least master's degree education in the United States with a correlation coefficient (R) of -0.107 and weighted average of 19.0%. Similarly, the statistical analysis conducted on geographies consisting of 207,281,799 people shows a poor positive correlation between the proportion of Iroquois and percentage of population with at least master's degree education in the United States with a correlation coefficient (R) of 0.125 and weighted average of 12.9%, a difference of 47.1%.
Master's Degree Correlation Summary
| Measurement | Immigrants from Greece | Iroquois |
| Minimum | 0.57% | 1.2% |
| Maximum | 41.0% | 18.3% |
| Range | 40.4% | 17.2% |
| Mean | 18.9% | 8.1% |
| Median | 19.3% | 7.9% |
| Interquartile 25% (IQ1) | 15.1% | 5.6% |
| Interquartile 75% (IQ3) | 22.3% | 10.8% |
| Interquartile Range (IQR) | 7.2% | 5.2% |
| Standard Deviation (Sample) | 7.0% | 4.1% |
| Standard Deviation (Population) | 7.0% | 4.1% |
Similar Demographics by Master's Degree
Demographics Similar to Immigrants from Greece by Master's Degree
In terms of master's degree, the demographic groups most similar to Immigrants from Greece are Immigrants from Saudi Arabia (19.0%, a difference of 0.010%), Immigrants from Malaysia (18.9%, a difference of 0.28%), Immigrants from Belarus (18.9%, a difference of 0.39%), Immigrants from Latvia (19.1%, a difference of 0.44%), and Immigrants from Norway (18.8%, a difference of 0.78%).
| Demographics | Rating | Rank | Master's Degree |
| Immigrants | Russia | 100.0 /100 | #36 | Exceptional 19.4% |
| Mongolians | 100.0 /100 | #37 | Exceptional 19.4% |
| Bolivians | 100.0 /100 | #38 | Exceptional 19.3% |
| Immigrants | Spain | 100.0 /100 | #39 | Exceptional 19.1% |
| Immigrants | Bolivia | 100.0 /100 | #40 | Exceptional 19.1% |
| Immigrants | Latvia | 100.0 /100 | #41 | Exceptional 19.1% |
| Immigrants | Saudi Arabia | 100.0 /100 | #42 | Exceptional 19.0% |
| Immigrants | Greece | 100.0 /100 | #43 | Exceptional 19.0% |
| Immigrants | Malaysia | 100.0 /100 | #44 | Exceptional 18.9% |
| Immigrants | Belarus | 100.0 /100 | #45 | Exceptional 18.9% |
| Immigrants | Norway | 100.0 /100 | #46 | Exceptional 18.8% |
| Immigrants | Austria | 100.0 /100 | #47 | Exceptional 18.8% |
| Paraguayans | 100.0 /100 | #48 | Exceptional 18.8% |
| Estonians | 100.0 /100 | #49 | Exceptional 18.8% |
| Bulgarians | 100.0 /100 | #50 | Exceptional 18.8% |
Demographics Similar to Iroquois by Master's Degree
In terms of master's degree, the demographic groups most similar to Iroquois are Immigrants from Cambodia (12.9%, a difference of 0.030%), Immigrants from Bahamas (12.9%, a difference of 0.070%), African (12.9%, a difference of 0.090%), Cree (12.8%, a difference of 0.40%), and Liberian (12.8%, a difference of 0.40%).
| Demographics | Rating | Rank | Master's Degree |
| Guamanians/Chamorros | 2.2 /100 | #240 | Tragic 13.1% |
| U.S. Virgin Islanders | 2.1 /100 | #241 | Tragic 13.1% |
| Spanish Americans | 1.9 /100 | #242 | Tragic 13.0% |
| Immigrants | Jamaica | 1.9 /100 | #243 | Tragic 13.0% |
| Delaware | 1.7 /100 | #244 | Tragic 13.0% |
| Immigrants | Bahamas | 1.4 /100 | #245 | Tragic 12.9% |
| Immigrants | Cambodia | 1.4 /100 | #246 | Tragic 12.9% |
| Iroquois | 1.4 /100 | #247 | Tragic 12.9% |
| Africans | 1.4 /100 | #248 | Tragic 12.9% |
| Cree | 1.3 /100 | #249 | Tragic 12.8% |
| Liberians | 1.3 /100 | #250 | Tragic 12.8% |
| Tlingit-Haida | 1.3 /100 | #251 | Tragic 12.8% |
| French American Indians | 1.0 /100 | #252 | Tragic 12.7% |
| Immigrants | Dominica | 0.8 /100 | #253 | Tragic 12.6% |
| Indonesians | 0.8 /100 | #254 | Tragic 12.6% |