Immigrants from Greece vs Immigrants from England Master's Degree
COMPARE
Immigrants from Greece
Immigrants from England
Master's Degree
Master's Degree Comparison
Immigrants from Greece
Immigrants from England
19.0%
MASTER'S DEGREE
100.0/ 100
METRIC RATING
43rd/ 347
METRIC RANK
17.0%
MASTER'S DEGREE
98.8/ 100
METRIC RATING
97th/ 347
METRIC RANK
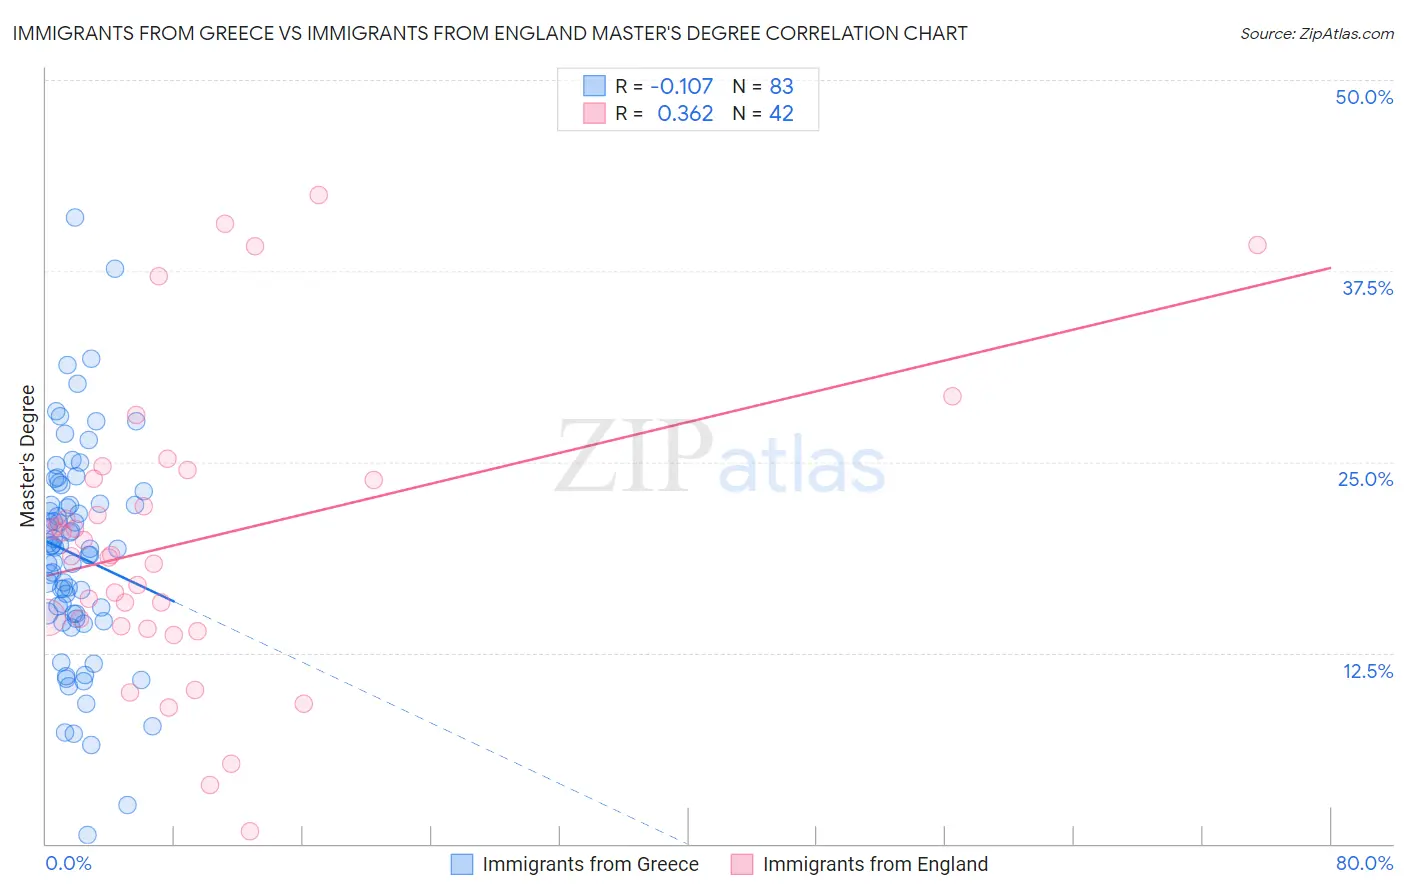
Immigrants from Greece vs Immigrants from England Master's Degree Correlation Chart
The statistical analysis conducted on geographies consisting of 216,873,414 people shows a poor negative correlation between the proportion of Immigrants from Greece and percentage of population with at least master's degree education in the United States with a correlation coefficient (R) of -0.107 and weighted average of 19.0%. Similarly, the statistical analysis conducted on geographies consisting of 391,825,279 people shows a mild positive correlation between the proportion of Immigrants from England and percentage of population with at least master's degree education in the United States with a correlation coefficient (R) of 0.362 and weighted average of 17.0%, a difference of 11.3%.
Master's Degree Correlation Summary
| Measurement | Immigrants from Greece | Immigrants from England |
| Minimum | 0.57% | 0.79% |
| Maximum | 41.0% | 42.5% |
| Range | 40.4% | 41.7% |
| Mean | 18.9% | 19.9% |
| Median | 19.3% | 18.9% |
| Interquartile 25% (IQ1) | 15.1% | 14.3% |
| Interquartile 75% (IQ3) | 22.3% | 23.9% |
| Interquartile Range (IQR) | 7.2% | 9.6% |
| Standard Deviation (Sample) | 7.0% | 9.6% |
| Standard Deviation (Population) | 7.0% | 9.5% |
Similar Demographics by Master's Degree
Demographics Similar to Immigrants from Greece by Master's Degree
In terms of master's degree, the demographic groups most similar to Immigrants from Greece are Immigrants from Saudi Arabia (19.0%, a difference of 0.010%), Immigrants from Malaysia (18.9%, a difference of 0.28%), Immigrants from Belarus (18.9%, a difference of 0.39%), Immigrants from Latvia (19.1%, a difference of 0.44%), and Immigrants from Norway (18.8%, a difference of 0.78%).
| Demographics | Rating | Rank | Master's Degree |
| Immigrants | Russia | 100.0 /100 | #36 | Exceptional 19.4% |
| Mongolians | 100.0 /100 | #37 | Exceptional 19.4% |
| Bolivians | 100.0 /100 | #38 | Exceptional 19.3% |
| Immigrants | Spain | 100.0 /100 | #39 | Exceptional 19.1% |
| Immigrants | Bolivia | 100.0 /100 | #40 | Exceptional 19.1% |
| Immigrants | Latvia | 100.0 /100 | #41 | Exceptional 19.1% |
| Immigrants | Saudi Arabia | 100.0 /100 | #42 | Exceptional 19.0% |
| Immigrants | Greece | 100.0 /100 | #43 | Exceptional 19.0% |
| Immigrants | Malaysia | 100.0 /100 | #44 | Exceptional 18.9% |
| Immigrants | Belarus | 100.0 /100 | #45 | Exceptional 18.9% |
| Immigrants | Norway | 100.0 /100 | #46 | Exceptional 18.8% |
| Immigrants | Austria | 100.0 /100 | #47 | Exceptional 18.8% |
| Paraguayans | 100.0 /100 | #48 | Exceptional 18.8% |
| Estonians | 100.0 /100 | #49 | Exceptional 18.8% |
| Bulgarians | 100.0 /100 | #50 | Exceptional 18.8% |
Demographics Similar to Immigrants from England by Master's Degree
In terms of master's degree, the demographic groups most similar to Immigrants from England are Immigrants from Ukraine (17.0%, a difference of 0.10%), Laotian (17.0%, a difference of 0.15%), Immigrants from Northern Africa (17.1%, a difference of 0.16%), Immigrants from Morocco (17.1%, a difference of 0.19%), and Albanian (17.0%, a difference of 0.36%).
| Demographics | Rating | Rank | Master's Degree |
| Immigrants | Egypt | 99.1 /100 | #90 | Exceptional 17.2% |
| Romanians | 99.1 /100 | #91 | Exceptional 17.2% |
| Immigrants | North America | 99.1 /100 | #92 | Exceptional 17.2% |
| Immigrants | Italy | 99.1 /100 | #93 | Exceptional 17.2% |
| Ugandans | 99.0 /100 | #94 | Exceptional 17.1% |
| Immigrants | Morocco | 98.9 /100 | #95 | Exceptional 17.1% |
| Immigrants | Northern Africa | 98.9 /100 | #96 | Exceptional 17.1% |
| Immigrants | England | 98.8 /100 | #97 | Exceptional 17.0% |
| Immigrants | Ukraine | 98.8 /100 | #98 | Exceptional 17.0% |
| Laotians | 98.8 /100 | #99 | Exceptional 17.0% |
| Albanians | 98.7 /100 | #100 | Exceptional 17.0% |
| Immigrants | Nepal | 98.6 /100 | #101 | Exceptional 17.0% |
| Chileans | 98.6 /100 | #102 | Exceptional 16.9% |
| Alsatians | 98.4 /100 | #103 | Exceptional 16.9% |
| Ukrainians | 98.3 /100 | #104 | Exceptional 16.9% |