Russian vs Immigrants from England Master's Degree
COMPARE
Russian
Immigrants from England
Master's Degree
Master's Degree Comparison
Russians
Immigrants from England
19.5%
MASTER'S DEGREE
100.0/ 100
METRIC RATING
33rd/ 347
METRIC RANK
17.0%
MASTER'S DEGREE
98.8/ 100
METRIC RATING
97th/ 347
METRIC RANK
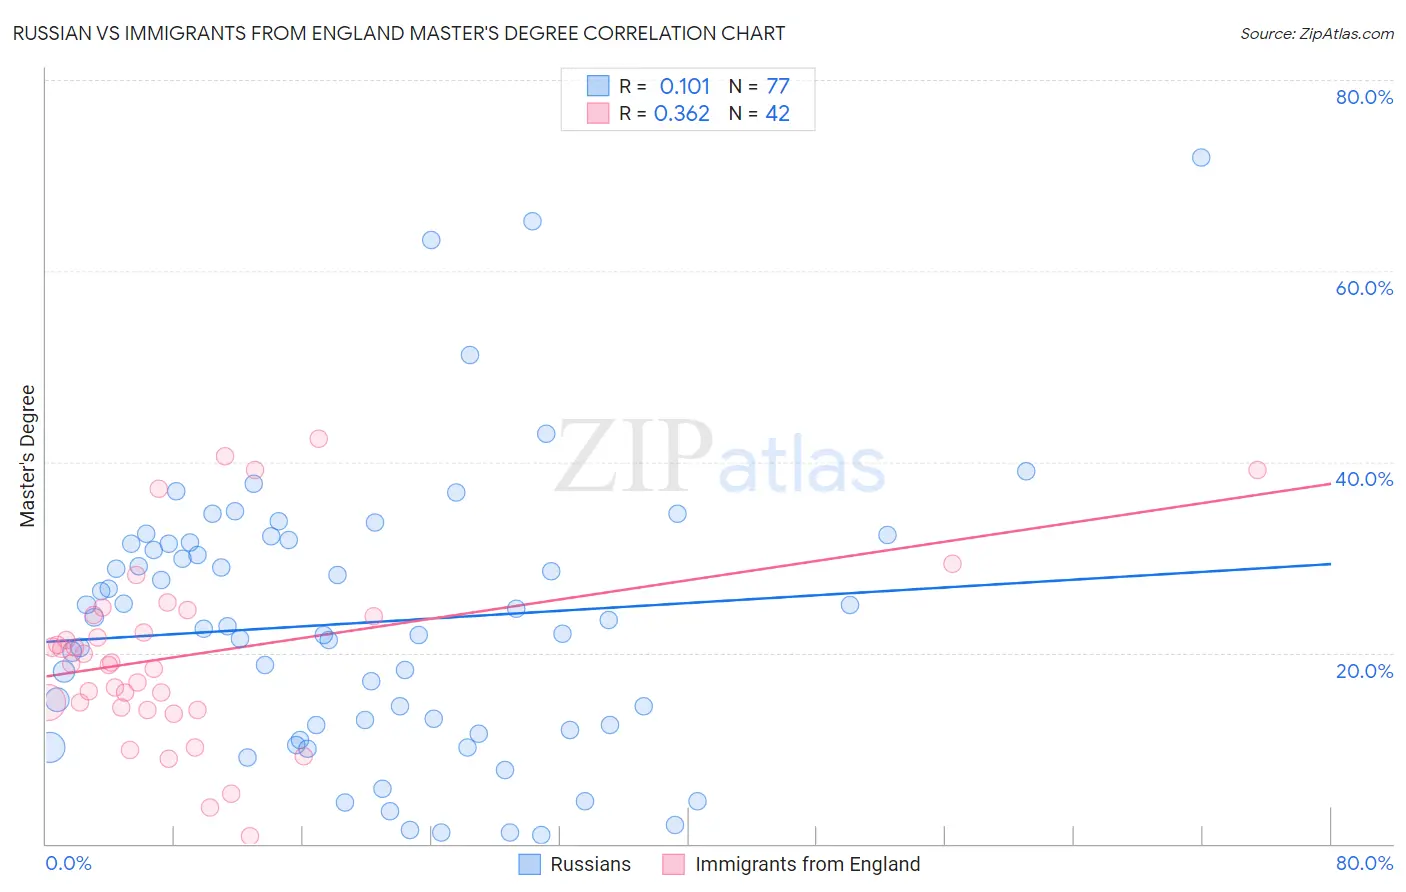
Russian vs Immigrants from England Master's Degree Correlation Chart
The statistical analysis conducted on geographies consisting of 511,948,246 people shows a poor positive correlation between the proportion of Russians and percentage of population with at least master's degree education in the United States with a correlation coefficient (R) of 0.101 and weighted average of 19.5%. Similarly, the statistical analysis conducted on geographies consisting of 391,825,279 people shows a mild positive correlation between the proportion of Immigrants from England and percentage of population with at least master's degree education in the United States with a correlation coefficient (R) of 0.362 and weighted average of 17.0%, a difference of 14.7%.
Master's Degree Correlation Summary
| Measurement | Russian | Immigrants from England |
| Minimum | 0.93% | 0.79% |
| Maximum | 71.9% | 42.5% |
| Range | 70.9% | 41.7% |
| Mean | 23.2% | 19.9% |
| Median | 22.8% | 18.9% |
| Interquartile 25% (IQ1) | 12.2% | 14.3% |
| Interquartile 75% (IQ3) | 31.5% | 23.9% |
| Interquartile Range (IQR) | 19.3% | 9.6% |
| Standard Deviation (Sample) | 14.4% | 9.6% |
| Standard Deviation (Population) | 14.3% | 9.5% |
Similar Demographics by Master's Degree
Demographics Similar to Russians by Master's Degree
In terms of master's degree, the demographic groups most similar to Russians are Immigrants from Denmark (19.5%, a difference of 0.030%), Immigrants from Northern Europe (19.5%, a difference of 0.36%), Immigrants from Russia (19.4%, a difference of 0.73%), Mongolian (19.4%, a difference of 0.77%), and Burmese (19.7%, a difference of 0.79%).
| Demographics | Rating | Rank | Master's Degree |
| Cambodians | 100.0 /100 | #26 | Exceptional 20.0% |
| Immigrants | Sri Lanka | 100.0 /100 | #27 | Exceptional 19.9% |
| Turks | 100.0 /100 | #28 | Exceptional 19.9% |
| Latvians | 100.0 /100 | #29 | Exceptional 19.8% |
| Immigrants | Turkey | 100.0 /100 | #30 | Exceptional 19.7% |
| Immigrants | Korea | 100.0 /100 | #31 | Exceptional 19.7% |
| Burmese | 100.0 /100 | #32 | Exceptional 19.7% |
| Russians | 100.0 /100 | #33 | Exceptional 19.5% |
| Immigrants | Denmark | 100.0 /100 | #34 | Exceptional 19.5% |
| Immigrants | Northern Europe | 100.0 /100 | #35 | Exceptional 19.5% |
| Immigrants | Russia | 100.0 /100 | #36 | Exceptional 19.4% |
| Mongolians | 100.0 /100 | #37 | Exceptional 19.4% |
| Bolivians | 100.0 /100 | #38 | Exceptional 19.3% |
| Immigrants | Spain | 100.0 /100 | #39 | Exceptional 19.1% |
| Immigrants | Bolivia | 100.0 /100 | #40 | Exceptional 19.1% |
Demographics Similar to Immigrants from England by Master's Degree
In terms of master's degree, the demographic groups most similar to Immigrants from England are Immigrants from Ukraine (17.0%, a difference of 0.10%), Laotian (17.0%, a difference of 0.15%), Immigrants from Northern Africa (17.1%, a difference of 0.16%), Immigrants from Morocco (17.1%, a difference of 0.19%), and Albanian (17.0%, a difference of 0.36%).
| Demographics | Rating | Rank | Master's Degree |
| Immigrants | Egypt | 99.1 /100 | #90 | Exceptional 17.2% |
| Romanians | 99.1 /100 | #91 | Exceptional 17.2% |
| Immigrants | North America | 99.1 /100 | #92 | Exceptional 17.2% |
| Immigrants | Italy | 99.1 /100 | #93 | Exceptional 17.2% |
| Ugandans | 99.0 /100 | #94 | Exceptional 17.1% |
| Immigrants | Morocco | 98.9 /100 | #95 | Exceptional 17.1% |
| Immigrants | Northern Africa | 98.9 /100 | #96 | Exceptional 17.1% |
| Immigrants | England | 98.8 /100 | #97 | Exceptional 17.0% |
| Immigrants | Ukraine | 98.8 /100 | #98 | Exceptional 17.0% |
| Laotians | 98.8 /100 | #99 | Exceptional 17.0% |
| Albanians | 98.7 /100 | #100 | Exceptional 17.0% |
| Immigrants | Nepal | 98.6 /100 | #101 | Exceptional 17.0% |
| Chileans | 98.6 /100 | #102 | Exceptional 16.9% |
| Alsatians | 98.4 /100 | #103 | Exceptional 16.9% |
| Ukrainians | 98.3 /100 | #104 | Exceptional 16.9% |