Immigrants from Fiji vs Chippewa Master's Degree
COMPARE
Immigrants from Fiji
Chippewa
Master's Degree
Master's Degree Comparison
Immigrants from Fiji
Chippewa
12.4%
MASTER'S DEGREE
0.5/ 100
METRIC RATING
265th/ 347
METRIC RANK
11.4%
MASTER'S DEGREE
0.1/ 100
METRIC RATING
300th/ 347
METRIC RANK
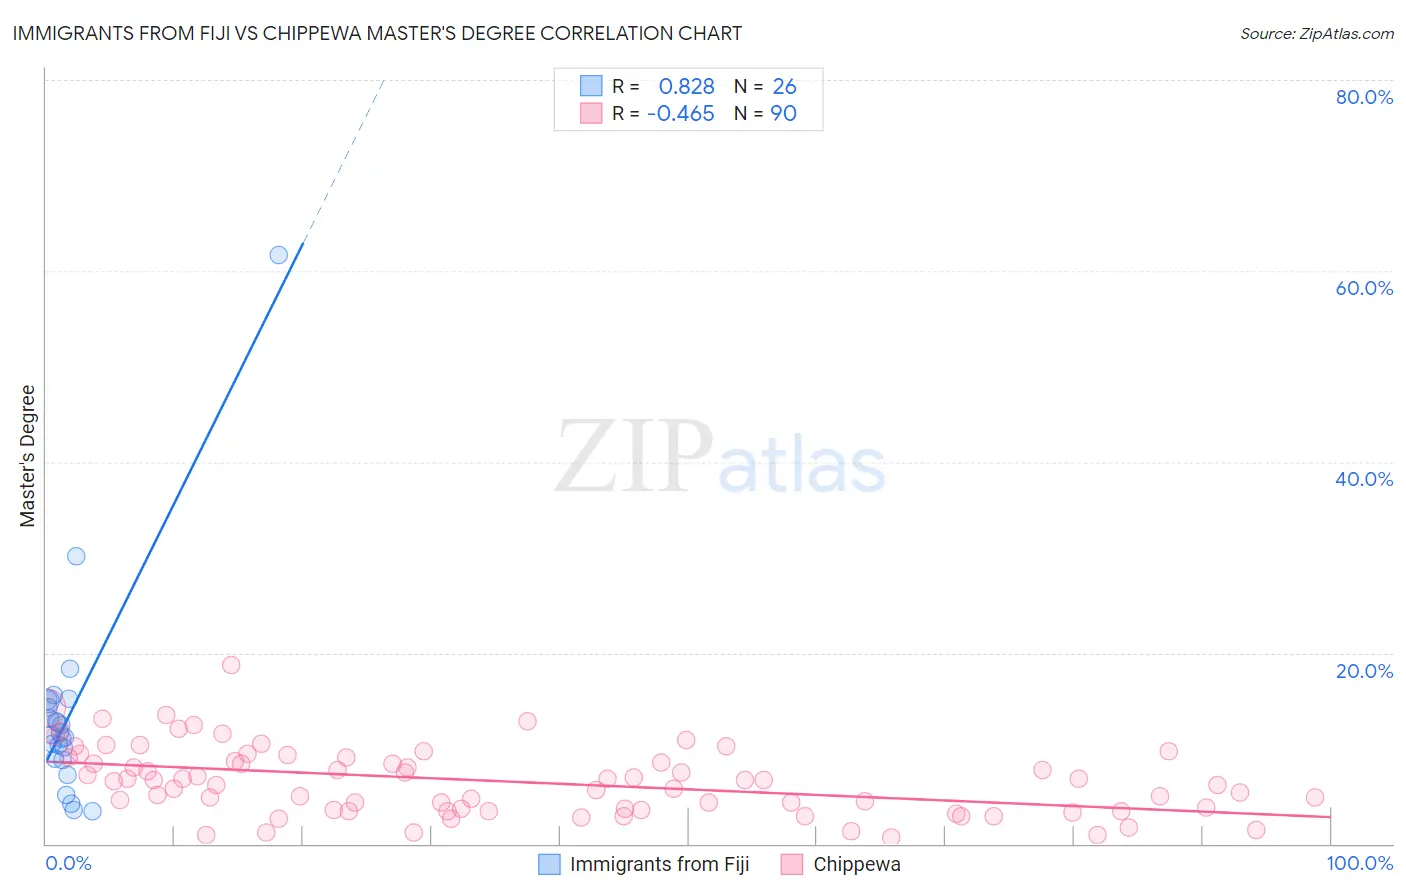
Immigrants from Fiji vs Chippewa Master's Degree Correlation Chart
The statistical analysis conducted on geographies consisting of 93,754,667 people shows a very strong positive correlation between the proportion of Immigrants from Fiji and percentage of population with at least master's degree education in the United States with a correlation coefficient (R) of 0.828 and weighted average of 12.4%. Similarly, the statistical analysis conducted on geographies consisting of 215,015,908 people shows a moderate negative correlation between the proportion of Chippewa and percentage of population with at least master's degree education in the United States with a correlation coefficient (R) of -0.465 and weighted average of 11.4%, a difference of 8.7%.
Master's Degree Correlation Summary
| Measurement | Immigrants from Fiji | Chippewa |
| Minimum | 3.5% | 0.64% |
| Maximum | 61.7% | 18.7% |
| Range | 58.2% | 18.0% |
| Mean | 13.6% | 6.5% |
| Median | 11.5% | 6.6% |
| Interquartile 25% (IQ1) | 8.9% | 3.6% |
| Interquartile 75% (IQ3) | 14.9% | 9.0% |
| Interquartile Range (IQR) | 6.0% | 5.4% |
| Standard Deviation (Sample) | 11.2% | 3.6% |
| Standard Deviation (Population) | 11.0% | 3.5% |
Similar Demographics by Master's Degree
Demographics Similar to Immigrants from Fiji by Master's Degree
In terms of master's degree, the demographic groups most similar to Immigrants from Fiji are Belizean (12.4%, a difference of 0.020%), Bahamian (12.4%, a difference of 0.16%), Central American Indian (12.4%, a difference of 0.19%), Nicaraguan (12.5%, a difference of 0.42%), and Tongan (12.5%, a difference of 0.61%).
| Demographics | Rating | Rank | Master's Degree |
| Immigrants | Liberia | 0.6 /100 | #258 | Tragic 12.5% |
| Japanese | 0.6 /100 | #259 | Tragic 12.5% |
| Dominicans | 0.6 /100 | #260 | Tragic 12.5% |
| Tongans | 0.6 /100 | #261 | Tragic 12.5% |
| Nicaraguans | 0.6 /100 | #262 | Tragic 12.5% |
| Central American Indians | 0.5 /100 | #263 | Tragic 12.4% |
| Belizeans | 0.5 /100 | #264 | Tragic 12.4% |
| Immigrants | Fiji | 0.5 /100 | #265 | Tragic 12.4% |
| Bahamians | 0.5 /100 | #266 | Tragic 12.4% |
| Americans | 0.4 /100 | #267 | Tragic 12.3% |
| Native Hawaiians | 0.4 /100 | #268 | Tragic 12.3% |
| Central Americans | 0.3 /100 | #269 | Tragic 12.2% |
| Salvadorans | 0.3 /100 | #270 | Tragic 12.2% |
| Haitians | 0.3 /100 | #271 | Tragic 12.1% |
| Comanche | 0.3 /100 | #272 | Tragic 12.1% |
Demographics Similar to Chippewa by Master's Degree
In terms of master's degree, the demographic groups most similar to Chippewa are Chickasaw (11.4%, a difference of 0.020%), Tsimshian (11.4%, a difference of 0.16%), Cherokee (11.4%, a difference of 0.47%), Samoan (11.5%, a difference of 0.48%), and Immigrants from Laos (11.4%, a difference of 0.49%).
| Demographics | Rating | Rank | Master's Degree |
| Alaska Natives | 0.1 /100 | #293 | Tragic 11.6% |
| Hawaiians | 0.1 /100 | #294 | Tragic 11.6% |
| Marshallese | 0.1 /100 | #295 | Tragic 11.6% |
| Alaskan Athabascans | 0.1 /100 | #296 | Tragic 11.6% |
| Immigrants | Yemen | 0.1 /100 | #297 | Tragic 11.6% |
| Samoans | 0.1 /100 | #298 | Tragic 11.5% |
| Chickasaw | 0.1 /100 | #299 | Tragic 11.4% |
| Chippewa | 0.1 /100 | #300 | Tragic 11.4% |
| Tsimshian | 0.1 /100 | #301 | Tragic 11.4% |
| Cherokee | 0.1 /100 | #302 | Tragic 11.4% |
| Immigrants | Laos | 0.1 /100 | #303 | Tragic 11.4% |
| Immigrants | Cabo Verde | 0.1 /100 | #304 | Tragic 11.3% |
| Immigrants | Latin America | 0.0 /100 | #305 | Tragic 11.3% |
| Mexican American Indians | 0.0 /100 | #306 | Tragic 11.2% |
| Cheyenne | 0.0 /100 | #307 | Tragic 11.2% |