Immigrants from Micronesia vs Immigrants from Cuba Kindergarten
COMPARE
Immigrants from Micronesia
Immigrants from Cuba
Kindergarten
Kindergarten Comparison
Immigrants from Micronesia
Immigrants from Cuba
98.0%
KINDERGARTEN
57.7/ 100
METRIC RATING
164th/ 347
METRIC RANK
97.1%
KINDERGARTEN
0.0/ 100
METRIC RATING
299th/ 347
METRIC RANK
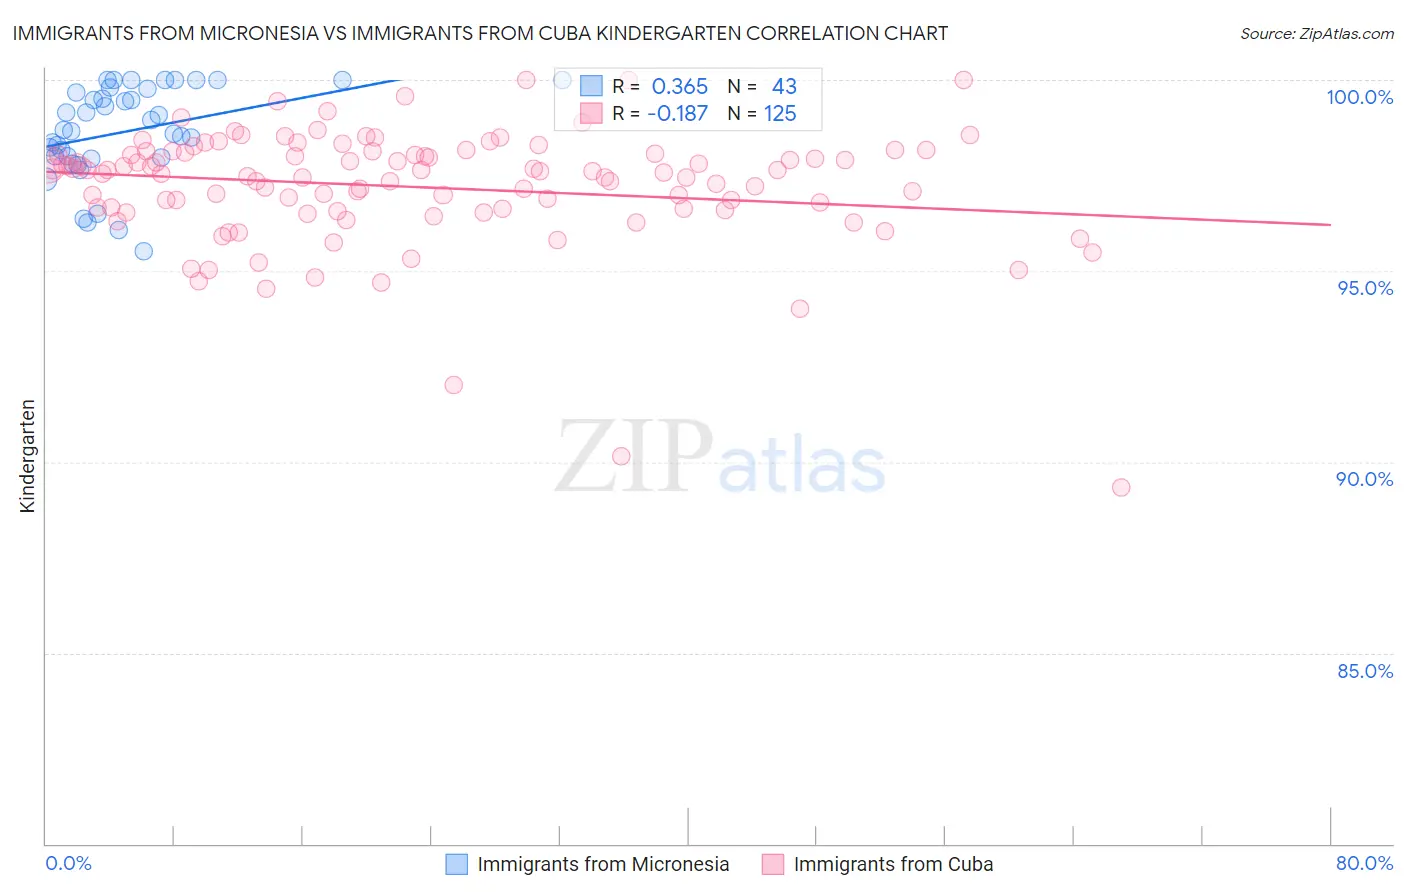
Immigrants from Micronesia vs Immigrants from Cuba Kindergarten Correlation Chart
The statistical analysis conducted on geographies consisting of 61,604,657 people shows a mild positive correlation between the proportion of Immigrants from Micronesia and percentage of population with at least kindergarten education in the United States with a correlation coefficient (R) of 0.365 and weighted average of 98.0%. Similarly, the statistical analysis conducted on geographies consisting of 326,028,159 people shows a poor negative correlation between the proportion of Immigrants from Cuba and percentage of population with at least kindergarten education in the United States with a correlation coefficient (R) of -0.187 and weighted average of 97.1%, a difference of 0.87%.
Kindergarten Correlation Summary
| Measurement | Immigrants from Micronesia | Immigrants from Cuba |
| Minimum | 95.5% | 89.3% |
| Maximum | 100.0% | 100.0% |
| Range | 4.5% | 10.7% |
| Mean | 98.7% | 97.2% |
| Median | 98.7% | 97.6% |
| Interquartile 25% (IQ1) | 98.0% | 96.6% |
| Interquartile 75% (IQ3) | 99.8% | 98.1% |
| Interquartile Range (IQR) | 1.8% | 1.5% |
| Standard Deviation (Sample) | 1.2% | 1.6% |
| Standard Deviation (Population) | 1.2% | 1.6% |
Similar Demographics by Kindergarten
Demographics Similar to Immigrants from Micronesia by Kindergarten
In terms of kindergarten, the demographic groups most similar to Immigrants from Micronesia are Immigrants from Russia (98.0%, a difference of 0.0%), Immigrants from Eastern Europe (98.0%, a difference of 0.0%), Immigrants from Italy (98.0%, a difference of 0.0%), Spanish American (98.0%, a difference of 0.0%), and Ugandan (98.0%, a difference of 0.0%).
| Demographics | Rating | Rank | Kindergarten |
| Immigrants | North Macedonia | 66.4 /100 | #157 | Good 98.0% |
| Venezuelans | 64.7 /100 | #158 | Good 98.0% |
| French American Indians | 63.7 /100 | #159 | Good 98.0% |
| Immigrants | Russia | 59.0 /100 | #160 | Average 98.0% |
| Immigrants | Eastern Europe | 59.0 /100 | #161 | Average 98.0% |
| Immigrants | Italy | 58.9 /100 | #162 | Average 98.0% |
| Spanish Americans | 57.8 /100 | #163 | Average 98.0% |
| Immigrants | Micronesia | 57.7 /100 | #164 | Average 98.0% |
| Ugandans | 56.9 /100 | #165 | Average 98.0% |
| Chileans | 56.3 /100 | #166 | Average 98.0% |
| Immigrants | Spain | 54.6 /100 | #167 | Average 98.0% |
| Navajo | 54.4 /100 | #168 | Average 98.0% |
| Immigrants | Korea | 54.1 /100 | #169 | Average 98.0% |
| Bermudans | 54.0 /100 | #170 | Average 98.0% |
| Immigrants | Jordan | 54.0 /100 | #171 | Average 98.0% |
Demographics Similar to Immigrants from Cuba by Kindergarten
In terms of kindergarten, the demographic groups most similar to Immigrants from Cuba are Immigrants from Dominica (97.1%, a difference of 0.010%), Haitian (97.1%, a difference of 0.010%), Central American Indian (97.2%, a difference of 0.030%), Immigrants from South Eastern Asia (97.1%, a difference of 0.030%), and Immigrants from Caribbean (97.1%, a difference of 0.060%).
| Demographics | Rating | Rank | Kindergarten |
| British West Indians | 0.0 /100 | #292 | Tragic 97.3% |
| Malaysians | 0.0 /100 | #293 | Tragic 97.2% |
| Immigrants | Immigrants | 0.0 /100 | #294 | Tragic 97.2% |
| Immigrants | Grenada | 0.0 /100 | #295 | Tragic 97.2% |
| Immigrants | Eritrea | 0.0 /100 | #296 | Tragic 97.2% |
| Central American Indians | 0.0 /100 | #297 | Tragic 97.2% |
| Immigrants | Dominica | 0.0 /100 | #298 | Tragic 97.1% |
| Immigrants | Cuba | 0.0 /100 | #299 | Tragic 97.1% |
| Haitians | 0.0 /100 | #300 | Tragic 97.1% |
| Immigrants | South Eastern Asia | 0.0 /100 | #301 | Tragic 97.1% |
| Immigrants | Caribbean | 0.0 /100 | #302 | Tragic 97.1% |
| Somalis | 0.0 /100 | #303 | Tragic 97.0% |
| Nicaraguans | 0.0 /100 | #304 | Tragic 97.0% |
| Ecuadorians | 0.0 /100 | #305 | Tragic 97.0% |
| Belizeans | 0.0 /100 | #306 | Tragic 97.0% |