Immigrants from Fiji vs Honduran Male Unemployment
COMPARE
Immigrants from Fiji
Honduran
Male Unemployment
Male Unemployment Comparison
Immigrants from Fiji
Hondurans
6.1%
MALE UNEMPLOYMENT
0.0/ 100
METRIC RATING
278th/ 347
METRIC RANK
5.6%
MALE UNEMPLOYMENT
1.1/ 100
METRIC RATING
237th/ 347
METRIC RANK
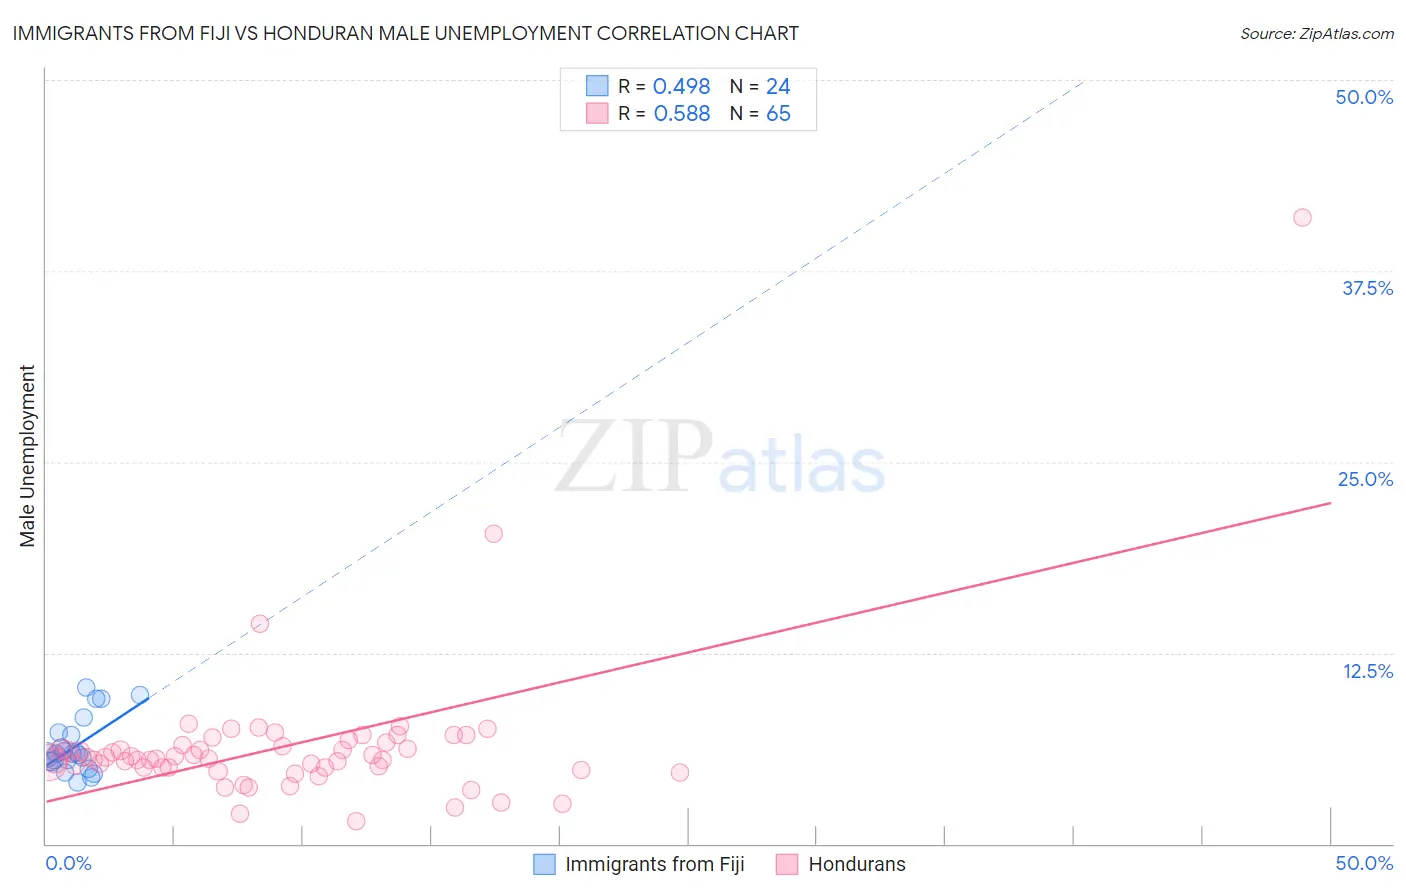
Immigrants from Fiji vs Honduran Male Unemployment Correlation Chart
The statistical analysis conducted on geographies consisting of 93,715,426 people shows a moderate positive correlation between the proportion of Immigrants from Fiji and unemployment rate among males in the United States with a correlation coefficient (R) of 0.498 and weighted average of 6.1%. Similarly, the statistical analysis conducted on geographies consisting of 356,702,099 people shows a substantial positive correlation between the proportion of Hondurans and unemployment rate among males in the United States with a correlation coefficient (R) of 0.588 and weighted average of 5.6%, a difference of 7.5%.
Male Unemployment Correlation Summary
| Measurement | Immigrants from Fiji | Honduran |
| Minimum | 4.0% | 1.5% |
| Maximum | 10.3% | 41.0% |
| Range | 6.3% | 39.5% |
| Mean | 6.4% | 6.4% |
| Median | 5.9% | 5.5% |
| Interquartile 25% (IQ1) | 5.4% | 5.0% |
| Interquartile 75% (IQ3) | 7.2% | 6.6% |
| Interquartile Range (IQR) | 1.8% | 1.6% |
| Standard Deviation (Sample) | 1.8% | 5.0% |
| Standard Deviation (Population) | 1.8% | 5.0% |
Similar Demographics by Male Unemployment
Demographics Similar to Immigrants from Fiji by Male Unemployment
In terms of male unemployment, the demographic groups most similar to Immigrants from Fiji are Immigrants from Liberia (6.1%, a difference of 0.12%), Ghanaian (6.1%, a difference of 0.50%), Tlingit-Haida (6.0%, a difference of 0.55%), Menominee (6.0%, a difference of 0.64%), and Immigrants from Sierra Leone (6.0%, a difference of 0.80%).
| Demographics | Rating | Rank | Male Unemployment |
| Blackfeet | 0.0 /100 | #271 | Tragic 6.0% |
| Immigrants | Uzbekistan | 0.0 /100 | #272 | Tragic 6.0% |
| Armenians | 0.0 /100 | #273 | Tragic 6.0% |
| Immigrants | Sierra Leone | 0.0 /100 | #274 | Tragic 6.0% |
| Menominee | 0.0 /100 | #275 | Tragic 6.0% |
| Tlingit-Haida | 0.0 /100 | #276 | Tragic 6.0% |
| Immigrants | Liberia | 0.0 /100 | #277 | Tragic 6.1% |
| Immigrants | Fiji | 0.0 /100 | #278 | Tragic 6.1% |
| Ghanaians | 0.0 /100 | #279 | Tragic 6.1% |
| Immigrants | Ghana | 0.0 /100 | #280 | Tragic 6.2% |
| Sierra Leoneans | 0.0 /100 | #281 | Tragic 6.2% |
| Ecuadorians | 0.0 /100 | #282 | Tragic 6.2% |
| Immigrants | Western Africa | 0.0 /100 | #283 | Tragic 6.2% |
| Spanish American Indians | 0.0 /100 | #284 | Tragic 6.2% |
| Immigrants | Ecuador | 0.0 /100 | #285 | Tragic 6.2% |
Demographics Similar to Hondurans by Male Unemployment
In terms of male unemployment, the demographic groups most similar to Hondurans are Native Hawaiian (5.6%, a difference of 0.050%), Immigrants from Guatemala (5.6%, a difference of 0.050%), Guatemalan (5.6%, a difference of 0.090%), Immigrants from Cameroon (5.6%, a difference of 0.12%), and Salvadoran (5.7%, a difference of 0.16%).
| Demographics | Rating | Rank | Male Unemployment |
| Immigrants | Africa | 1.7 /100 | #230 | Tragic 5.6% |
| Choctaw | 1.6 /100 | #231 | Tragic 5.6% |
| Moroccans | 1.6 /100 | #232 | Tragic 5.6% |
| Somalis | 1.5 /100 | #233 | Tragic 5.6% |
| Immigrants | Somalia | 1.5 /100 | #234 | Tragic 5.6% |
| Immigrants | Honduras | 1.5 /100 | #235 | Tragic 5.6% |
| Guatemalans | 1.2 /100 | #236 | Tragic 5.6% |
| Hondurans | 1.1 /100 | #237 | Tragic 5.6% |
| Native Hawaiians | 1.1 /100 | #238 | Tragic 5.6% |
| Immigrants | Guatemala | 1.1 /100 | #239 | Tragic 5.6% |
| Immigrants | Cameroon | 1.0 /100 | #240 | Tragic 5.6% |
| Salvadorans | 1.0 /100 | #241 | Tragic 5.7% |
| Ottawa | 0.9 /100 | #242 | Tragic 5.7% |
| Bangladeshis | 0.8 /100 | #243 | Tragic 5.7% |
| Immigrants | El Salvador | 0.7 /100 | #244 | Tragic 5.7% |