Immigrants from Europe vs Yakama Births to Unmarried Women
COMPARE
Immigrants from Europe
Yakama
Births to Unmarried Women
Births to Unmarried Women Comparison
Immigrants from Europe
Yakama
28.4%
BIRTHS TO UNMARRIED WOMEN
98.7/ 100
METRIC RATING
68th/ 347
METRIC RANK
40.3%
BIRTHS TO UNMARRIED WOMEN
0.0/ 100
METRIC RATING
319th/ 347
METRIC RANK
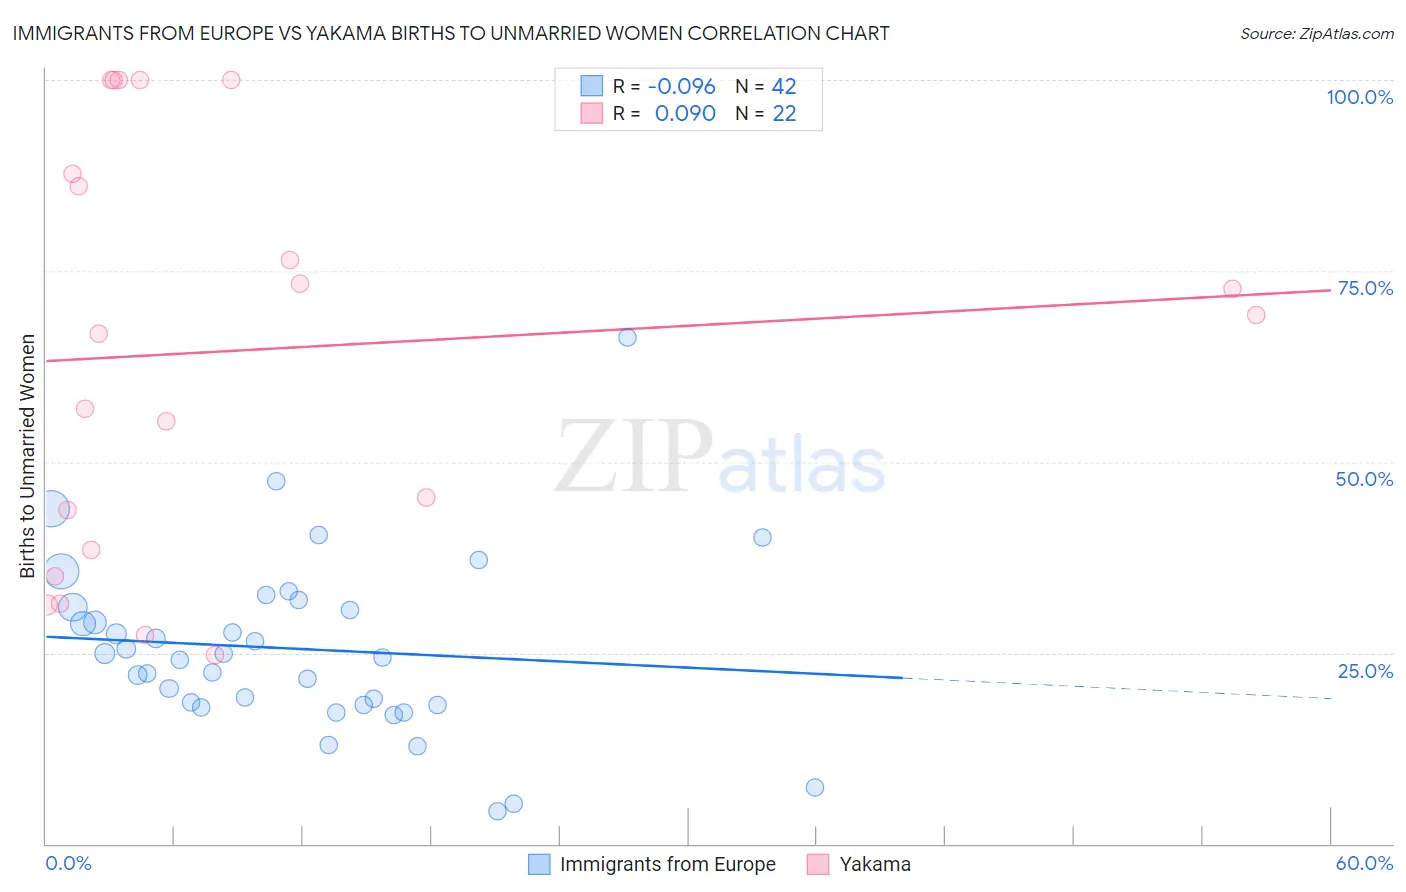
Immigrants from Europe vs Yakama Births to Unmarried Women Correlation Chart
The statistical analysis conducted on geographies consisting of 491,178,975 people shows a slight negative correlation between the proportion of Immigrants from Europe and percentage of births to unmarried women in the United States with a correlation coefficient (R) of -0.096 and weighted average of 28.4%. Similarly, the statistical analysis conducted on geographies consisting of 19,190,199 people shows a slight positive correlation between the proportion of Yakama and percentage of births to unmarried women in the United States with a correlation coefficient (R) of 0.090 and weighted average of 40.3%, a difference of 41.8%.
Births to Unmarried Women Correlation Summary
| Measurement | Immigrants from Europe | Yakama |
| Minimum | 4.2% | 24.7% |
| Maximum | 66.3% | 100.0% |
| Range | 62.1% | 75.3% |
| Mean | 25.5% | 64.6% |
| Median | 24.6% | 67.9% |
| Interquartile 25% (IQ1) | 18.1% | 38.5% |
| Interquartile 75% (IQ3) | 30.9% | 87.8% |
| Interquartile Range (IQR) | 12.8% | 49.3% |
| Standard Deviation (Sample) | 11.6% | 27.0% |
| Standard Deviation (Population) | 11.4% | 26.3% |
Similar Demographics by Births to Unmarried Women
Demographics Similar to Immigrants from Europe by Births to Unmarried Women
In terms of births to unmarried women, the demographic groups most similar to Immigrants from Europe are Bolivian (28.5%, a difference of 0.040%), Palestinian (28.4%, a difference of 0.050%), Laotian (28.5%, a difference of 0.10%), Immigrants from Egypt (28.4%, a difference of 0.16%), and Immigrants from Czechoslovakia (28.4%, a difference of 0.18%).
| Demographics | Rating | Rank | Births to Unmarried Women |
| Immigrants | North Macedonia | 99.1 /100 | #61 | Exceptional 28.1% |
| Egyptians | 99.0 /100 | #62 | Exceptional 28.2% |
| Immigrants | Serbia | 98.9 /100 | #63 | Exceptional 28.3% |
| Tongans | 98.8 /100 | #64 | Exceptional 28.4% |
| Immigrants | Czechoslovakia | 98.8 /100 | #65 | Exceptional 28.4% |
| Immigrants | Egypt | 98.8 /100 | #66 | Exceptional 28.4% |
| Palestinians | 98.7 /100 | #67 | Exceptional 28.4% |
| Immigrants | Europe | 98.7 /100 | #68 | Exceptional 28.4% |
| Bolivians | 98.7 /100 | #69 | Exceptional 28.5% |
| Laotians | 98.6 /100 | #70 | Exceptional 28.5% |
| Jordanians | 98.5 /100 | #71 | Exceptional 28.5% |
| Immigrants | Sweden | 98.5 /100 | #72 | Exceptional 28.5% |
| Albanians | 98.5 /100 | #73 | Exceptional 28.5% |
| Immigrants | Bolivia | 98.5 /100 | #74 | Exceptional 28.6% |
| Immigrants | Switzerland | 98.4 /100 | #75 | Exceptional 28.6% |
Demographics Similar to Yakama by Births to Unmarried Women
In terms of births to unmarried women, the demographic groups most similar to Yakama are Crow (40.4%, a difference of 0.060%), Immigrants from Bahamas (40.1%, a difference of 0.56%), Immigrants from Dominican Republic (40.1%, a difference of 0.62%), Bahamian (40.8%, a difference of 1.1%), and Apache (39.9%, a difference of 1.2%).
| Demographics | Rating | Rank | Births to Unmarried Women |
| U.S. Virgin Islanders | 0.0 /100 | #312 | Tragic 39.6% |
| Africans | 0.0 /100 | #313 | Tragic 39.7% |
| Immigrants | Caribbean | 0.0 /100 | #314 | Tragic 39.8% |
| Dominicans | 0.0 /100 | #315 | Tragic 39.8% |
| Apache | 0.0 /100 | #316 | Tragic 39.9% |
| Immigrants | Dominican Republic | 0.0 /100 | #317 | Tragic 40.1% |
| Immigrants | Bahamas | 0.0 /100 | #318 | Tragic 40.1% |
| Yakama | 0.0 /100 | #319 | Tragic 40.3% |
| Crow | 0.0 /100 | #320 | Tragic 40.4% |
| Bahamians | 0.0 /100 | #321 | Tragic 40.8% |
| Cajuns | 0.0 /100 | #322 | Tragic 41.0% |
| Sioux | 0.0 /100 | #323 | Tragic 41.0% |
| Cape Verdeans | 0.0 /100 | #324 | Tragic 41.3% |
| Cheyenne | 0.0 /100 | #325 | Tragic 41.3% |
| Immigrants | Cuba | 0.0 /100 | #326 | Tragic 41.5% |