Immigrants from Eritrea vs Immigrants from Barbados Associate's Degree
COMPARE
Immigrants from Eritrea
Immigrants from Barbados
Associate's Degree
Associate's Degree Comparison
Immigrants from Eritrea
Immigrants from Barbados
48.1%
ASSOCIATE'S DEGREE
87.8/ 100
METRIC RATING
137th/ 347
METRIC RANK
43.3%
ASSOCIATE'S DEGREE
2.9/ 100
METRIC RATING
230th/ 347
METRIC RANK
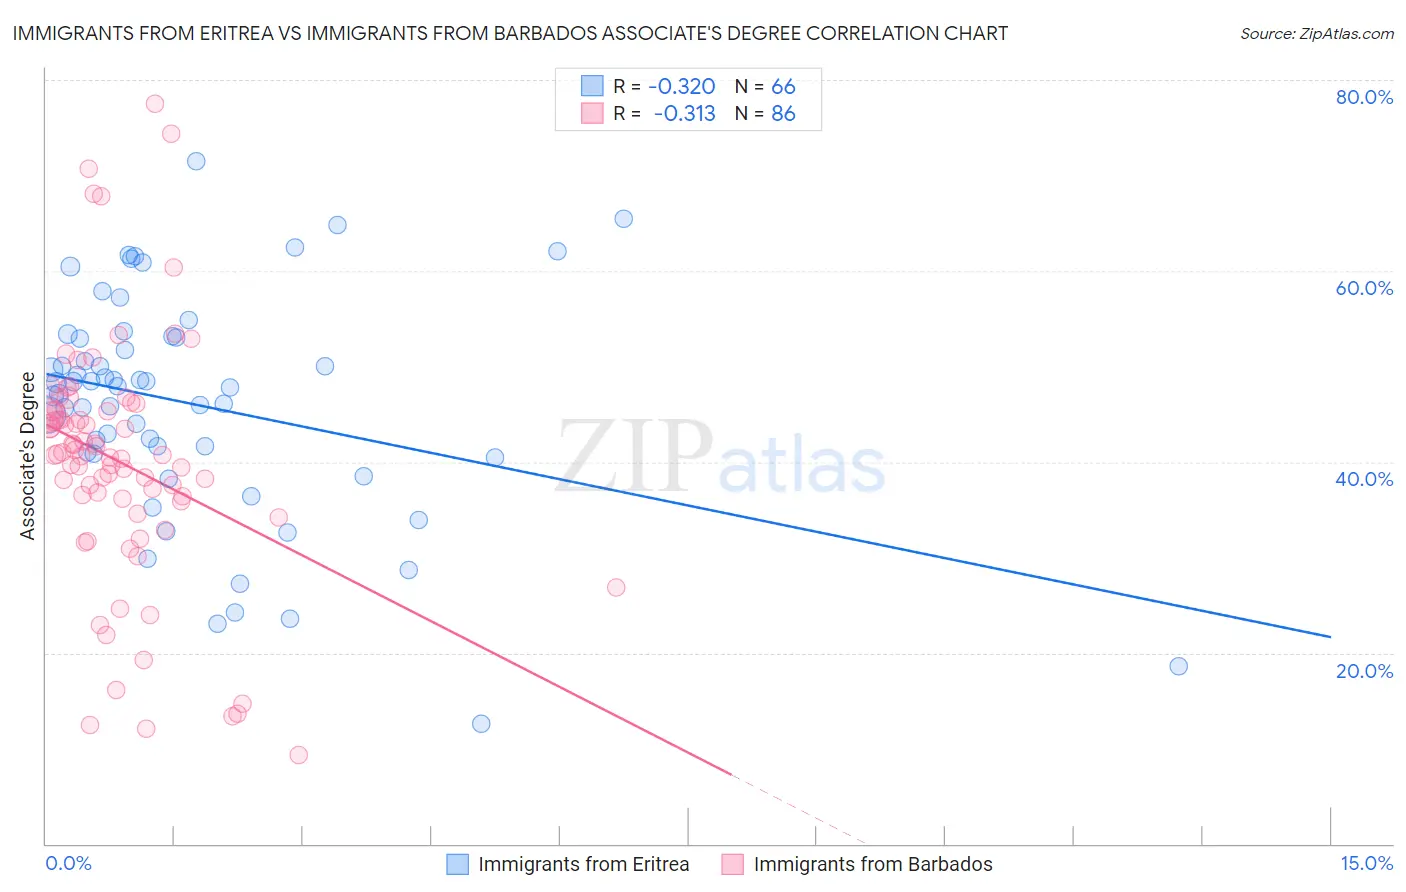
Immigrants from Eritrea vs Immigrants from Barbados Associate's Degree Correlation Chart
The statistical analysis conducted on geographies consisting of 104,852,788 people shows a mild negative correlation between the proportion of Immigrants from Eritrea and percentage of population with at least associate's degree education in the United States with a correlation coefficient (R) of -0.320 and weighted average of 48.1%. Similarly, the statistical analysis conducted on geographies consisting of 112,783,541 people shows a mild negative correlation between the proportion of Immigrants from Barbados and percentage of population with at least associate's degree education in the United States with a correlation coefficient (R) of -0.313 and weighted average of 43.3%, a difference of 11.0%.
Associate's Degree Correlation Summary
| Measurement | Immigrants from Eritrea | Immigrants from Barbados |
| Minimum | 12.6% | 9.3% |
| Maximum | 71.5% | 77.4% |
| Range | 58.9% | 68.2% |
| Mean | 46.0% | 40.0% |
| Median | 47.9% | 40.7% |
| Interquartile 25% (IQ1) | 40.9% | 35.9% |
| Interquartile 75% (IQ3) | 53.1% | 45.3% |
| Interquartile Range (IQR) | 12.2% | 9.5% |
| Standard Deviation (Sample) | 11.9% | 13.1% |
| Standard Deviation (Population) | 11.8% | 13.0% |
Similar Demographics by Associate's Degree
Demographics Similar to Immigrants from Eritrea by Associate's Degree
In terms of associate's degree, the demographic groups most similar to Immigrants from Eritrea are Pakistani (48.1%, a difference of 0.040%), Polish (48.0%, a difference of 0.070%), European (48.2%, a difference of 0.22%), Moroccan (48.2%, a difference of 0.28%), and Assyrian/Chaldean/Syriac (48.2%, a difference of 0.30%).
| Demographics | Rating | Rank | Associate's Degree |
| Immigrants | Jordan | 91.2 /100 | #130 | Exceptional 48.4% |
| Icelanders | 90.8 /100 | #131 | Exceptional 48.3% |
| Immigrants | Albania | 89.9 /100 | #132 | Excellent 48.2% |
| Assyrians/Chaldeans/Syriacs | 89.4 /100 | #133 | Excellent 48.2% |
| Moroccans | 89.3 /100 | #134 | Excellent 48.2% |
| Europeans | 89.0 /100 | #135 | Excellent 48.2% |
| Pakistanis | 88.0 /100 | #136 | Excellent 48.1% |
| Immigrants | Eritrea | 87.8 /100 | #137 | Excellent 48.1% |
| Poles | 87.3 /100 | #138 | Excellent 48.0% |
| Slovenes | 85.1 /100 | #139 | Excellent 47.9% |
| Immigrants | Southern Europe | 84.4 /100 | #140 | Excellent 47.8% |
| Taiwanese | 83.3 /100 | #141 | Excellent 47.7% |
| Sierra Leoneans | 82.9 /100 | #142 | Excellent 47.7% |
| Norwegians | 81.0 /100 | #143 | Excellent 47.6% |
| Slavs | 80.5 /100 | #144 | Excellent 47.6% |
Demographics Similar to Immigrants from Barbados by Associate's Degree
In terms of associate's degree, the demographic groups most similar to Immigrants from Barbados are Liberian (43.3%, a difference of 0.010%), Immigrants from Trinidad and Tobago (43.3%, a difference of 0.070%), Hmong (43.4%, a difference of 0.23%), Native Hawaiian (43.1%, a difference of 0.43%), and Tongan (43.0%, a difference of 0.60%).
| Demographics | Rating | Rank | Associate's Degree |
| Sub-Saharan Africans | 5.5 /100 | #223 | Tragic 43.9% |
| West Indians | 5.2 /100 | #224 | Tragic 43.8% |
| Guamanians/Chamorros | 4.8 /100 | #225 | Tragic 43.8% |
| Immigrants | Burma/Myanmar | 4.3 /100 | #226 | Tragic 43.7% |
| Trinidadians and Tobagonians | 4.0 /100 | #227 | Tragic 43.6% |
| Hmong | 3.2 /100 | #228 | Tragic 43.4% |
| Immigrants | Trinidad and Tobago | 3.0 /100 | #229 | Tragic 43.3% |
| Immigrants | Barbados | 2.9 /100 | #230 | Tragic 43.3% |
| Liberians | 2.9 /100 | #231 | Tragic 43.3% |
| Native Hawaiians | 2.3 /100 | #232 | Tragic 43.1% |
| Tongans | 2.2 /100 | #233 | Tragic 43.0% |
| Tlingit-Haida | 2.1 /100 | #234 | Tragic 43.0% |
| Ecuadorians | 2.0 /100 | #235 | Tragic 43.0% |
| Immigrants | St. Vincent and the Grenadines | 1.9 /100 | #236 | Tragic 42.9% |
| Immigrants | Nonimmigrants | 1.9 /100 | #237 | Tragic 42.9% |