Immigrants from Eritrea vs South American 2nd Grade
COMPARE
Immigrants from Eritrea
South American
2nd Grade
2nd Grade Comparison
Immigrants from Eritrea
South Americans
97.2%
2ND GRADE
0.0/ 100
METRIC RATING
292nd/ 347
METRIC RANK
97.5%
2ND GRADE
0.9/ 100
METRIC RATING
246th/ 347
METRIC RANK
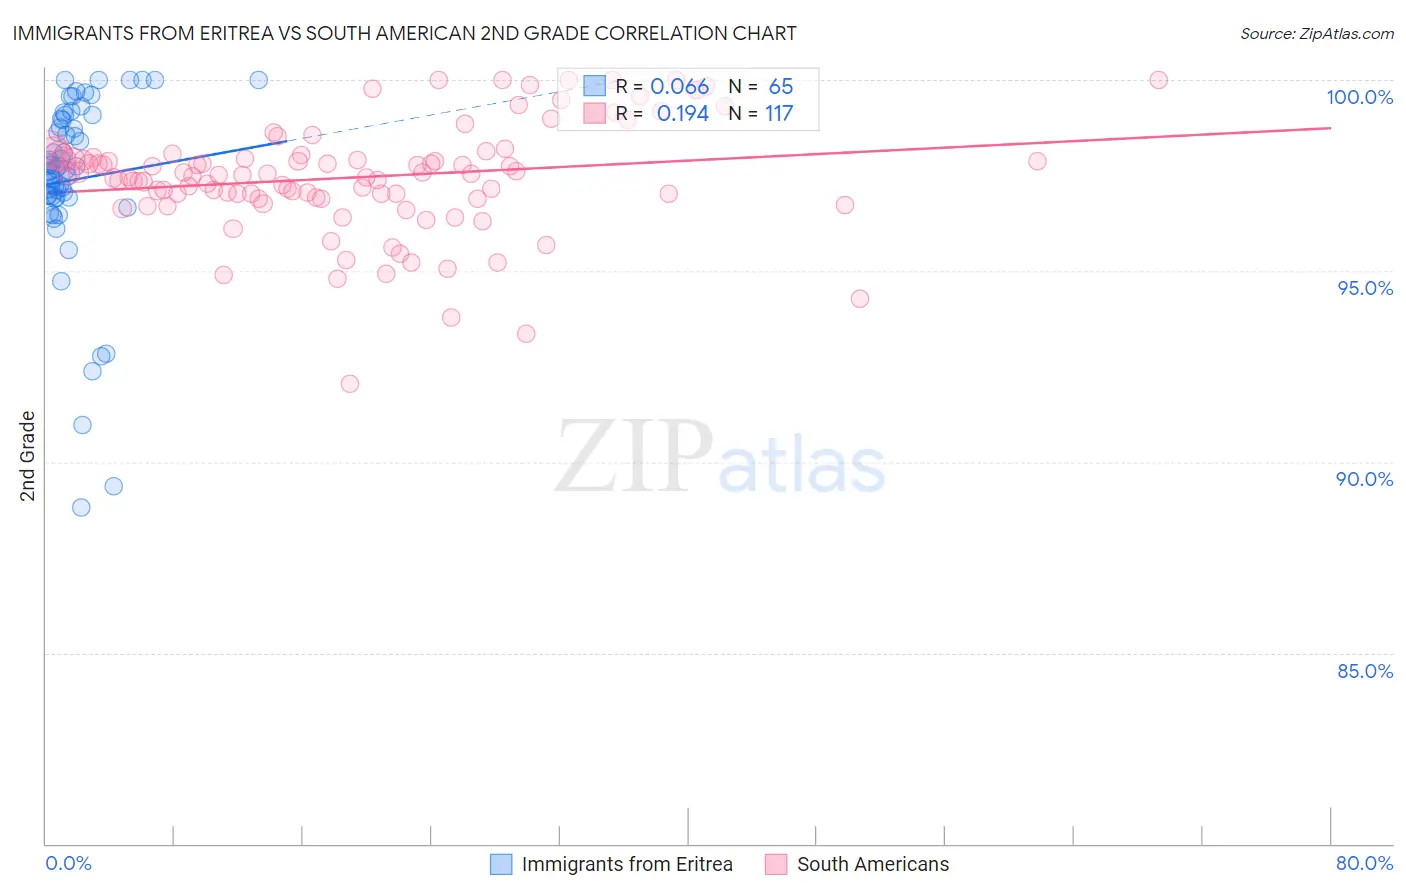
Immigrants from Eritrea vs South American 2nd Grade Correlation Chart
The statistical analysis conducted on geographies consisting of 104,801,381 people shows a slight positive correlation between the proportion of Immigrants from Eritrea and percentage of population with at least 2nd grade education in the United States with a correlation coefficient (R) of 0.066 and weighted average of 97.2%. Similarly, the statistical analysis conducted on geographies consisting of 494,178,447 people shows a poor positive correlation between the proportion of South Americans and percentage of population with at least 2nd grade education in the United States with a correlation coefficient (R) of 0.194 and weighted average of 97.5%, a difference of 0.35%.
2nd Grade Correlation Summary
| Measurement | Immigrants from Eritrea | South American |
| Minimum | 88.8% | 92.1% |
| Maximum | 100.0% | 100.0% |
| Range | 11.2% | 7.9% |
| Mean | 97.4% | 97.5% |
| Median | 97.7% | 97.5% |
| Interquartile 25% (IQ1) | 96.9% | 96.9% |
| Interquartile 75% (IQ3) | 99.0% | 98.0% |
| Interquartile Range (IQR) | 2.1% | 1.1% |
| Standard Deviation (Sample) | 2.4% | 1.4% |
| Standard Deviation (Population) | 2.4% | 1.4% |
Similar Demographics by 2nd Grade
Demographics Similar to Immigrants from Eritrea by 2nd Grade
In terms of 2nd grade, the demographic groups most similar to Immigrants from Eritrea are British West Indian (97.2%, a difference of 0.010%), Immigrants from Afghanistan (97.2%, a difference of 0.020%), Houma (97.2%, a difference of 0.030%), Immigrants from St. Vincent and the Grenadines (97.2%, a difference of 0.030%), and Malaysian (97.1%, a difference of 0.040%).
| Demographics | Rating | Rank | 2nd Grade |
| Immigrants | Hong Kong | 0.0 /100 | #285 | Tragic 97.2% |
| Immigrants | Barbados | 0.0 /100 | #286 | Tragic 97.2% |
| Immigrants | Portugal | 0.0 /100 | #287 | Tragic 97.2% |
| Immigrants | Thailand | 0.0 /100 | #288 | Tragic 97.2% |
| Houma | 0.0 /100 | #289 | Tragic 97.2% |
| Immigrants | St. Vincent and the Grenadines | 0.0 /100 | #290 | Tragic 97.2% |
| Immigrants | Afghanistan | 0.0 /100 | #291 | Tragic 97.2% |
| Immigrants | Eritrea | 0.0 /100 | #292 | Tragic 97.2% |
| British West Indians | 0.0 /100 | #293 | Tragic 97.2% |
| Malaysians | 0.0 /100 | #294 | Tragic 97.1% |
| Immigrants | Grenada | 0.0 /100 | #295 | Tragic 97.1% |
| Immigrants | Immigrants | 0.0 /100 | #296 | Tragic 97.1% |
| Immigrants | Cuba | 0.0 /100 | #297 | Tragic 97.0% |
| Immigrants | Dominica | 0.0 /100 | #298 | Tragic 97.0% |
| Haitians | 0.0 /100 | #299 | Tragic 97.0% |
Demographics Similar to South Americans by 2nd Grade
In terms of 2nd grade, the demographic groups most similar to South Americans are Immigrants from Eastern Africa (97.5%, a difference of 0.0%), Immigrants from Senegal (97.5%, a difference of 0.0%), Immigrants from Middle Africa (97.5%, a difference of 0.0%), Bolivian (97.5%, a difference of 0.0%), and Immigrants from Iraq (97.5%, a difference of 0.010%).
| Demographics | Rating | Rank | 2nd Grade |
| Liberians | 1.6 /100 | #239 | Tragic 97.6% |
| Koreans | 1.5 /100 | #240 | Tragic 97.5% |
| Ethiopians | 1.2 /100 | #241 | Tragic 97.5% |
| Immigrants | Indonesia | 1.2 /100 | #242 | Tragic 97.5% |
| Asians | 1.1 /100 | #243 | Tragic 97.5% |
| Immigrants | Iraq | 1.0 /100 | #244 | Tragic 97.5% |
| Immigrants | Eastern Africa | 0.9 /100 | #245 | Tragic 97.5% |
| South Americans | 0.9 /100 | #246 | Tragic 97.5% |
| Immigrants | Senegal | 0.9 /100 | #247 | Tragic 97.5% |
| Immigrants | Middle Africa | 0.9 /100 | #248 | Tragic 97.5% |
| Bolivians | 0.9 /100 | #249 | Tragic 97.5% |
| Peruvians | 0.9 /100 | #250 | Tragic 97.5% |
| Immigrants | Africa | 0.8 /100 | #251 | Tragic 97.5% |
| Immigrants | Asia | 0.7 /100 | #252 | Tragic 97.5% |
| Puerto Ricans | 0.7 /100 | #253 | Tragic 97.5% |