Immigrants from El Salvador vs Chilean Professional Degree
COMPARE
Immigrants from El Salvador
Chilean
Professional Degree
Professional Degree Comparison
Immigrants from El Salvador
Chileans
3.5%
PROFESSIONAL DEGREE
0.3/ 100
METRIC RATING
287th/ 347
METRIC RANK
5.3%
PROFESSIONAL DEGREE
99.5/ 100
METRIC RATING
89th/ 347
METRIC RANK
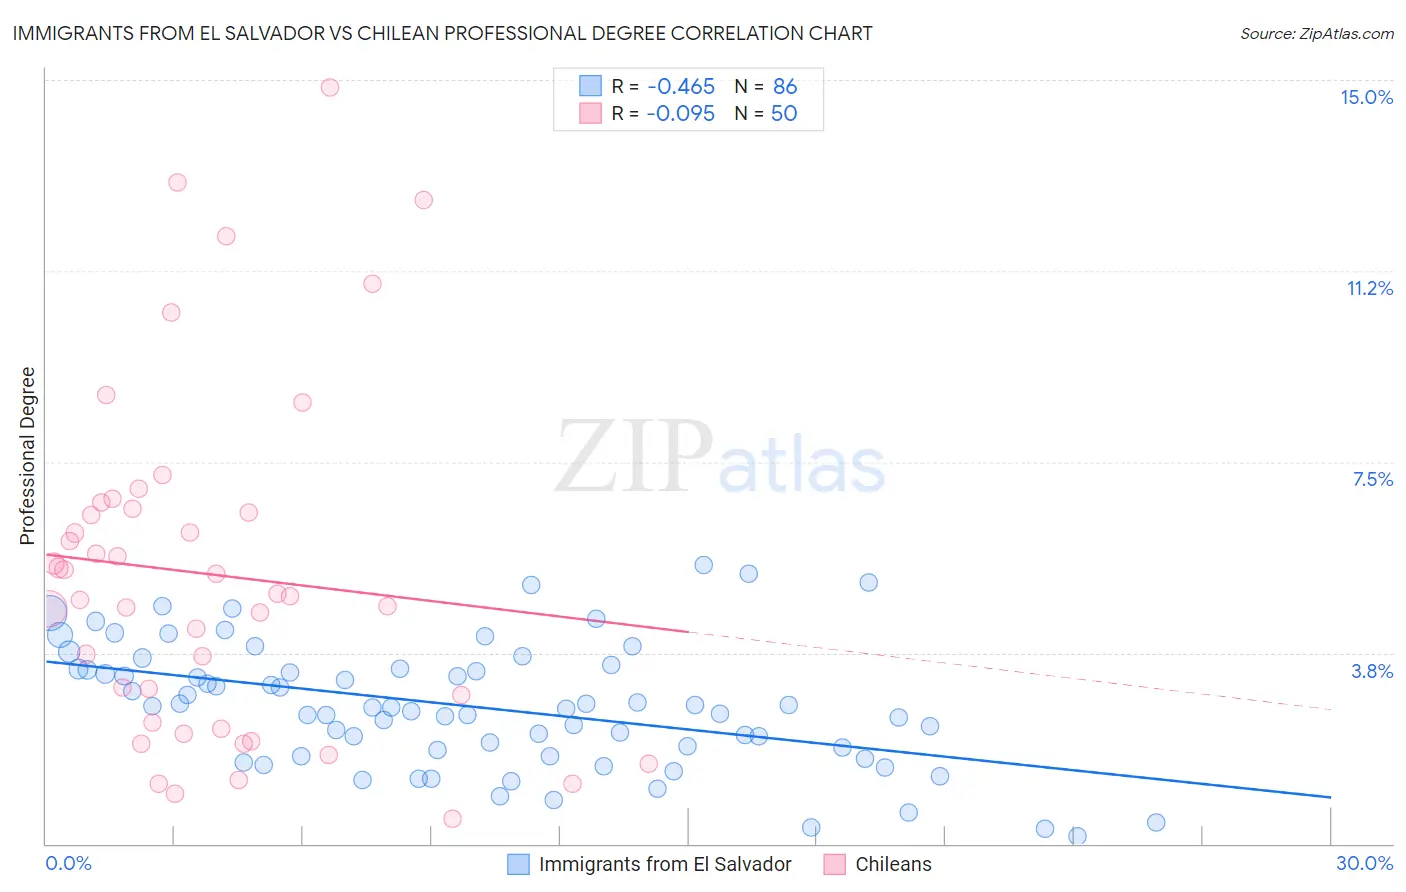
Immigrants from El Salvador vs Chilean Professional Degree Correlation Chart
The statistical analysis conducted on geographies consisting of 356,542,562 people shows a moderate negative correlation between the proportion of Immigrants from El Salvador and percentage of population with at least professional degree education in the United States with a correlation coefficient (R) of -0.465 and weighted average of 3.5%. Similarly, the statistical analysis conducted on geographies consisting of 256,484,571 people shows a slight negative correlation between the proportion of Chileans and percentage of population with at least professional degree education in the United States with a correlation coefficient (R) of -0.095 and weighted average of 5.3%, a difference of 51.2%.
Professional Degree Correlation Summary
| Measurement | Immigrants from El Salvador | Chilean |
| Minimum | 0.14% | 0.49% |
| Maximum | 5.5% | 14.9% |
| Range | 5.3% | 14.4% |
| Mean | 2.7% | 5.3% |
| Median | 2.7% | 4.9% |
| Interquartile 25% (IQ1) | 1.8% | 2.4% |
| Interquartile 75% (IQ3) | 3.4% | 6.6% |
| Interquartile Range (IQR) | 1.6% | 4.2% |
| Standard Deviation (Sample) | 1.2% | 3.4% |
| Standard Deviation (Population) | 1.2% | 3.3% |
Similar Demographics by Professional Degree
Demographics Similar to Immigrants from El Salvador by Professional Degree
In terms of professional degree, the demographic groups most similar to Immigrants from El Salvador are Blackfeet (3.5%, a difference of 0.050%), Haitian (3.5%, a difference of 0.10%), Guatemalan (3.5%, a difference of 0.22%), Chippewa (3.5%, a difference of 0.23%), and Alaska Native (3.5%, a difference of 0.41%).
| Demographics | Rating | Rank | Professional Degree |
| Dominicans | 0.5 /100 | #280 | Tragic 3.5% |
| Apache | 0.5 /100 | #281 | Tragic 3.5% |
| Immigrants | Caribbean | 0.5 /100 | #282 | Tragic 3.5% |
| Comanche | 0.4 /100 | #283 | Tragic 3.5% |
| Salvadorans | 0.4 /100 | #284 | Tragic 3.5% |
| Hondurans | 0.3 /100 | #285 | Tragic 3.5% |
| Haitians | 0.3 /100 | #286 | Tragic 3.5% |
| Immigrants | El Salvador | 0.3 /100 | #287 | Tragic 3.5% |
| Blackfeet | 0.3 /100 | #288 | Tragic 3.5% |
| Guatemalans | 0.3 /100 | #289 | Tragic 3.5% |
| Chippewa | 0.3 /100 | #290 | Tragic 3.5% |
| Alaska Natives | 0.3 /100 | #291 | Tragic 3.5% |
| Immigrants | Belize | 0.3 /100 | #292 | Tragic 3.5% |
| Immigrants | Honduras | 0.3 /100 | #293 | Tragic 3.5% |
| Paiute | 0.3 /100 | #294 | Tragic 3.4% |
Demographics Similar to Chileans by Professional Degree
In terms of professional degree, the demographic groups most similar to Chileans are Egyptian (5.3%, a difference of 0.0%), Immigrants from Scotland (5.3%, a difference of 0.10%), Immigrants from Chile (5.3%, a difference of 0.14%), Immigrants from Zimbabwe (5.3%, a difference of 0.25%), and Greek (5.3%, a difference of 0.25%).
| Demographics | Rating | Rank | Professional Degree |
| Romanians | 99.6 /100 | #82 | Exceptional 5.3% |
| Carpatho Rusyns | 99.6 /100 | #83 | Exceptional 5.3% |
| Immigrants | Croatia | 99.6 /100 | #84 | Exceptional 5.3% |
| Immigrants | Zimbabwe | 99.6 /100 | #85 | Exceptional 5.3% |
| Greeks | 99.6 /100 | #86 | Exceptional 5.3% |
| Immigrants | Chile | 99.5 /100 | #87 | Exceptional 5.3% |
| Egyptians | 99.5 /100 | #88 | Exceptional 5.3% |
| Chileans | 99.5 /100 | #89 | Exceptional 5.3% |
| Immigrants | Scotland | 99.5 /100 | #90 | Exceptional 5.3% |
| Laotians | 99.5 /100 | #91 | Exceptional 5.2% |
| Immigrants | Eastern Europe | 99.5 /100 | #92 | Exceptional 5.2% |
| Northern Europeans | 99.3 /100 | #93 | Exceptional 5.2% |
| Alsatians | 99.3 /100 | #94 | Exceptional 5.2% |
| Zimbabweans | 99.3 /100 | #95 | Exceptional 5.2% |
| Immigrants | Uzbekistan | 99.2 /100 | #96 | Exceptional 5.2% |