Immigrants from Egypt vs Indian (Asian) 5th Grade
COMPARE
Immigrants from Egypt
Indian (Asian)
5th Grade
5th Grade Comparison
Immigrants from Egypt
Indians (Asian)
97.3%
5TH GRADE
32.9/ 100
METRIC RATING
189th/ 347
METRIC RANK
96.9%
5TH GRADE
1.9/ 100
METRIC RATING
240th/ 347
METRIC RANK
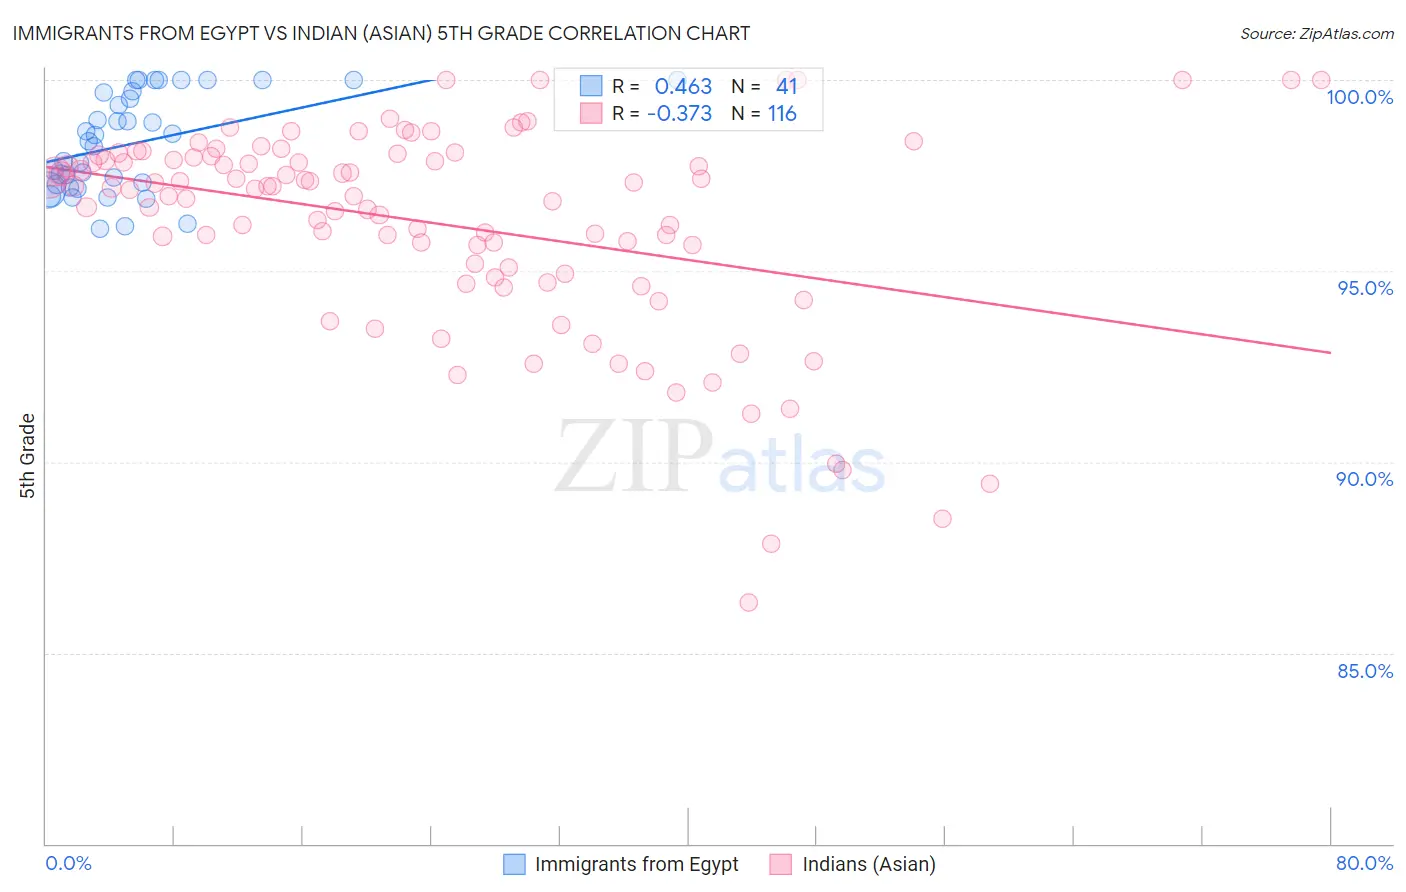
Immigrants from Egypt vs Indian (Asian) 5th Grade Correlation Chart
The statistical analysis conducted on geographies consisting of 245,485,794 people shows a moderate positive correlation between the proportion of Immigrants from Egypt and percentage of population with at least 5th grade education in the United States with a correlation coefficient (R) of 0.463 and weighted average of 97.3%. Similarly, the statistical analysis conducted on geographies consisting of 495,287,818 people shows a mild negative correlation between the proportion of Indians (Asian) and percentage of population with at least 5th grade education in the United States with a correlation coefficient (R) of -0.373 and weighted average of 96.9%, a difference of 0.34%.
5th Grade Correlation Summary
| Measurement | Immigrants from Egypt | Indian (Asian) |
| Minimum | 96.1% | 86.3% |
| Maximum | 100.0% | 100.0% |
| Range | 3.9% | 13.7% |
| Mean | 98.3% | 96.2% |
| Median | 98.4% | 97.2% |
| Interquartile 25% (IQ1) | 97.2% | 95.0% |
| Interquartile 75% (IQ3) | 99.7% | 98.0% |
| Interquartile Range (IQR) | 2.5% | 3.0% |
| Standard Deviation (Sample) | 1.3% | 2.7% |
| Standard Deviation (Population) | 1.3% | 2.7% |
Similar Demographics by 5th Grade
Demographics Similar to Immigrants from Egypt by 5th Grade
In terms of 5th grade, the demographic groups most similar to Immigrants from Egypt are Paraguayan (97.3%, a difference of 0.0%), Immigrants from Argentina (97.3%, a difference of 0.010%), Spanish American (97.3%, a difference of 0.010%), Black/African American (97.3%, a difference of 0.010%), and Immigrants from Brazil (97.3%, a difference of 0.010%).
| Demographics | Rating | Rank | 5th Grade |
| Mongolians | 39.4 /100 | #182 | Fair 97.3% |
| Immigrants | Ukraine | 38.6 /100 | #183 | Fair 97.3% |
| Immigrants | Venezuela | 38.4 /100 | #184 | Fair 97.3% |
| Dutch West Indians | 36.2 /100 | #185 | Fair 97.3% |
| Immigrants | Argentina | 36.1 /100 | #186 | Fair 97.3% |
| Spanish Americans | 34.7 /100 | #187 | Fair 97.3% |
| Paraguayans | 33.7 /100 | #188 | Fair 97.3% |
| Immigrants | Egypt | 32.9 /100 | #189 | Fair 97.3% |
| Blacks/African Americans | 31.8 /100 | #190 | Fair 97.3% |
| Immigrants | Brazil | 31.5 /100 | #191 | Fair 97.3% |
| Panamanians | 31.3 /100 | #192 | Fair 97.3% |
| Navajo | 29.0 /100 | #193 | Fair 97.2% |
| Immigrants | Albania | 28.5 /100 | #194 | Fair 97.2% |
| Guamanians/Chamorros | 26.8 /100 | #195 | Fair 97.2% |
| Hawaiians | 25.6 /100 | #196 | Fair 97.2% |
Demographics Similar to Indians (Asian) by 5th Grade
In terms of 5th grade, the demographic groups most similar to Indians (Asian) are Asian (96.9%, a difference of 0.0%), Nigerian (96.9%, a difference of 0.0%), Immigrants from Indonesia (96.9%, a difference of 0.010%), Immigrants from Asia (96.9%, a difference of 0.010%), and Immigrants from Costa Rica (96.9%, a difference of 0.020%).
| Demographics | Rating | Rank | 5th Grade |
| Sub-Saharan Africans | 3.3 /100 | #233 | Tragic 97.0% |
| Tohono O'odham | 3.2 /100 | #234 | Tragic 97.0% |
| Uruguayans | 3.2 /100 | #235 | Tragic 97.0% |
| Senegalese | 2.8 /100 | #236 | Tragic 97.0% |
| Immigrants | Indonesia | 2.0 /100 | #237 | Tragic 96.9% |
| Asians | 2.0 /100 | #238 | Tragic 96.9% |
| Nigerians | 1.9 /100 | #239 | Tragic 96.9% |
| Indians (Asian) | 1.9 /100 | #240 | Tragic 96.9% |
| Immigrants | Asia | 1.7 /100 | #241 | Tragic 96.9% |
| Immigrants | Costa Rica | 1.6 /100 | #242 | Tragic 96.9% |
| Immigrants | Eastern Africa | 1.6 /100 | #243 | Tragic 96.9% |
| Koreans | 1.6 /100 | #244 | Tragic 96.9% |
| Colombians | 1.3 /100 | #245 | Tragic 96.9% |
| Ethiopians | 1.2 /100 | #246 | Tragic 96.9% |
| Immigrants | Africa | 1.1 /100 | #247 | Tragic 96.9% |