Immigrants from Egypt vs Arab 5th Grade
COMPARE
Immigrants from Egypt
Arab
5th Grade
5th Grade Comparison
Immigrants from Egypt
Arabs
97.3%
5TH GRADE
32.9/ 100
METRIC RATING
189th/ 347
METRIC RANK
97.3%
5TH GRADE
53.4/ 100
METRIC RATING
172nd/ 347
METRIC RANK
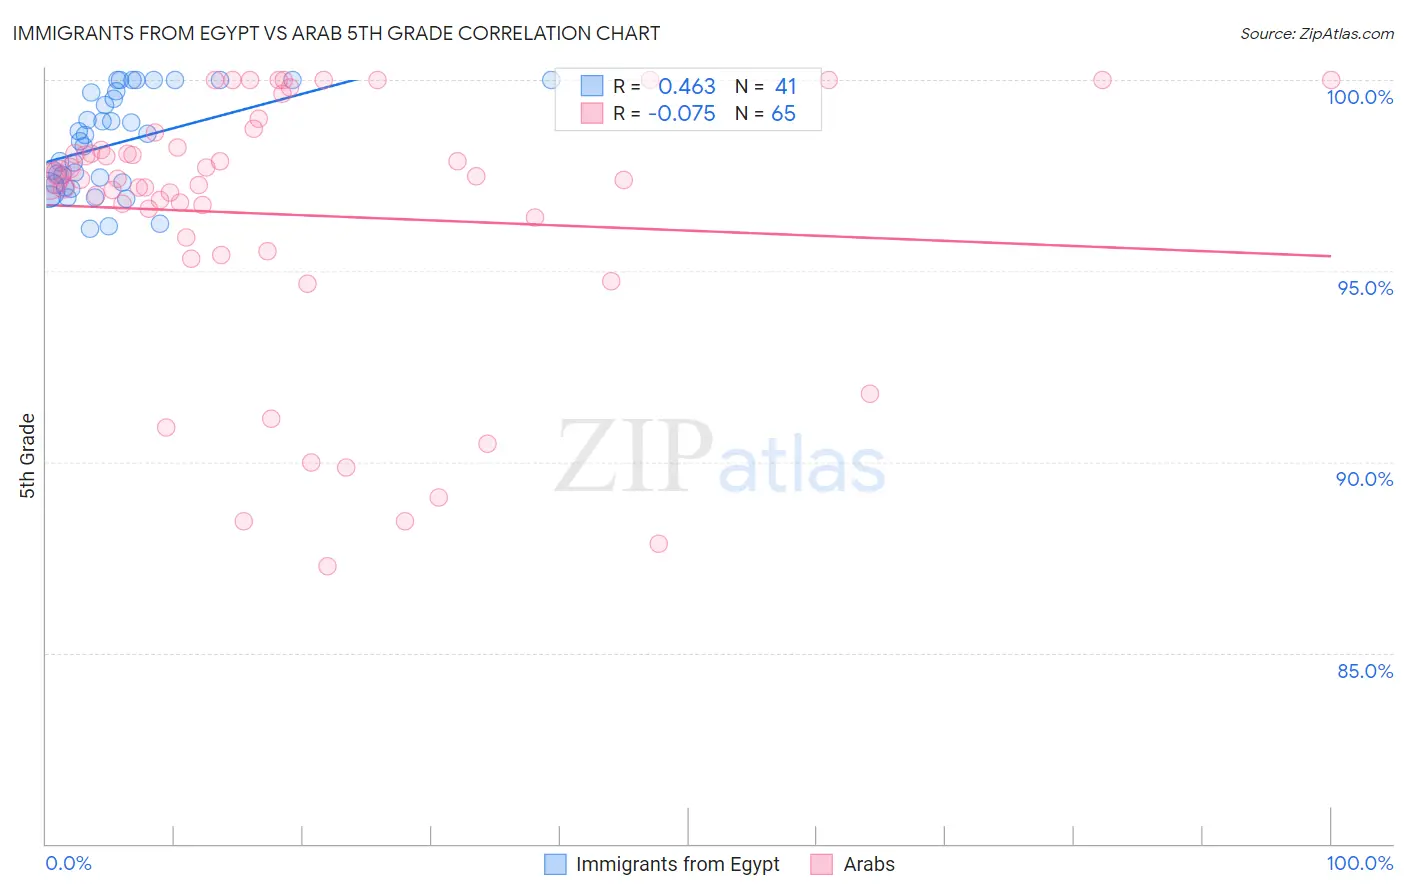
Immigrants from Egypt vs Arab 5th Grade Correlation Chart
The statistical analysis conducted on geographies consisting of 245,485,794 people shows a moderate positive correlation between the proportion of Immigrants from Egypt and percentage of population with at least 5th grade education in the United States with a correlation coefficient (R) of 0.463 and weighted average of 97.3%. Similarly, the statistical analysis conducted on geographies consisting of 486,871,007 people shows a slight negative correlation between the proportion of Arabs and percentage of population with at least 5th grade education in the United States with a correlation coefficient (R) of -0.075 and weighted average of 97.3%, a difference of 0.090%.
5th Grade Correlation Summary
| Measurement | Immigrants from Egypt | Arab |
| Minimum | 96.1% | 87.3% |
| Maximum | 100.0% | 100.0% |
| Range | 3.9% | 12.7% |
| Mean | 98.3% | 96.5% |
| Median | 98.4% | 97.4% |
| Interquartile 25% (IQ1) | 97.2% | 95.7% |
| Interquartile 75% (IQ3) | 99.7% | 98.4% |
| Interquartile Range (IQR) | 2.5% | 2.7% |
| Standard Deviation (Sample) | 1.3% | 3.5% |
| Standard Deviation (Population) | 1.3% | 3.4% |
Demographics Similar to Immigrants from Egypt and Arabs by 5th Grade
In terms of 5th grade, the demographic groups most similar to Immigrants from Egypt are Paraguayan (97.3%, a difference of 0.0%), Immigrants from Argentina (97.3%, a difference of 0.010%), Spanish American (97.3%, a difference of 0.010%), Black/African American (97.3%, a difference of 0.010%), and Dutch West Indian (97.3%, a difference of 0.020%). Similarly, the demographic groups most similar to Arabs are Venezuelan (97.3%, a difference of 0.0%), Immigrants from Sri Lanka (97.3%, a difference of 0.0%), Egyptian (97.3%, a difference of 0.0%), Immigrants from Kazakhstan (97.3%, a difference of 0.010%), and Immigrants from Micronesia (97.3%, a difference of 0.020%).
| Demographics | Rating | Rank | 5th Grade |
| Venezuelans | 54.0 /100 | #170 | Average 97.3% |
| Immigrants | Sri Lanka | 53.8 /100 | #171 | Average 97.3% |
| Arabs | 53.4 /100 | #172 | Average 97.3% |
| Egyptians | 52.4 /100 | #173 | Average 97.3% |
| Immigrants | Kazakhstan | 50.0 /100 | #174 | Average 97.3% |
| Immigrants | Micronesia | 48.8 /100 | #175 | Average 97.3% |
| Immigrants | Taiwan | 48.4 /100 | #176 | Average 97.3% |
| Immigrants | Spain | 47.0 /100 | #177 | Average 97.3% |
| Comanche | 42.1 /100 | #178 | Average 97.3% |
| Immigrants | Kenya | 40.3 /100 | #179 | Average 97.3% |
| Pakistanis | 40.2 /100 | #180 | Average 97.3% |
| Argentineans | 39.5 /100 | #181 | Fair 97.3% |
| Mongolians | 39.4 /100 | #182 | Fair 97.3% |
| Immigrants | Ukraine | 38.6 /100 | #183 | Fair 97.3% |
| Immigrants | Venezuela | 38.4 /100 | #184 | Fair 97.3% |
| Dutch West Indians | 36.2 /100 | #185 | Fair 97.3% |
| Immigrants | Argentina | 36.1 /100 | #186 | Fair 97.3% |
| Spanish Americans | 34.7 /100 | #187 | Fair 97.3% |
| Paraguayans | 33.7 /100 | #188 | Fair 97.3% |
| Immigrants | Egypt | 32.9 /100 | #189 | Fair 97.3% |
| Blacks/African Americans | 31.8 /100 | #190 | Fair 97.3% |