Mongolian vs Indian (Asian) 5th Grade
COMPARE
Mongolian
Indian (Asian)
5th Grade
5th Grade Comparison
Mongolians
Indians (Asian)
97.3%
5TH GRADE
39.4/ 100
METRIC RATING
182nd/ 347
METRIC RANK
96.9%
5TH GRADE
1.9/ 100
METRIC RATING
240th/ 347
METRIC RANK
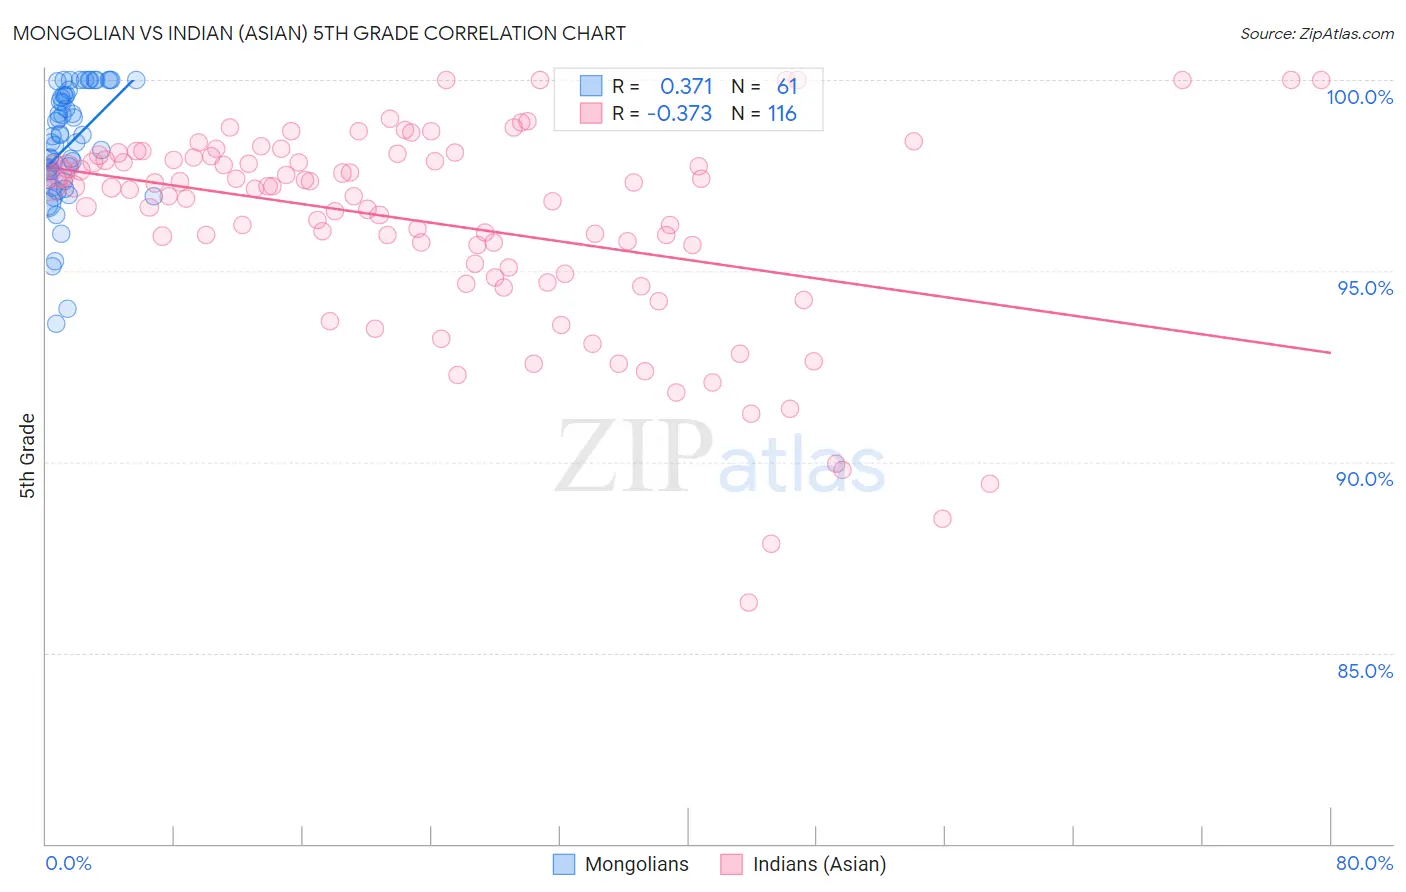
Mongolian vs Indian (Asian) 5th Grade Correlation Chart
The statistical analysis conducted on geographies consisting of 140,362,004 people shows a mild positive correlation between the proportion of Mongolians and percentage of population with at least 5th grade education in the United States with a correlation coefficient (R) of 0.371 and weighted average of 97.3%. Similarly, the statistical analysis conducted on geographies consisting of 495,287,818 people shows a mild negative correlation between the proportion of Indians (Asian) and percentage of population with at least 5th grade education in the United States with a correlation coefficient (R) of -0.373 and weighted average of 96.9%, a difference of 0.37%.
5th Grade Correlation Summary
| Measurement | Mongolian | Indian (Asian) |
| Minimum | 93.6% | 86.3% |
| Maximum | 100.0% | 100.0% |
| Range | 6.4% | 13.7% |
| Mean | 98.3% | 96.2% |
| Median | 98.5% | 97.2% |
| Interquartile 25% (IQ1) | 97.4% | 95.0% |
| Interquartile 75% (IQ3) | 99.6% | 98.0% |
| Interquartile Range (IQR) | 2.2% | 3.0% |
| Standard Deviation (Sample) | 1.5% | 2.7% |
| Standard Deviation (Population) | 1.5% | 2.7% |
Similar Demographics by 5th Grade
Demographics Similar to Mongolians by 5th Grade
In terms of 5th grade, the demographic groups most similar to Mongolians are Immigrants from Kenya (97.3%, a difference of 0.0%), Pakistani (97.3%, a difference of 0.0%), Argentinean (97.3%, a difference of 0.0%), Immigrants from Ukraine (97.3%, a difference of 0.0%), and Immigrants from Venezuela (97.3%, a difference of 0.0%).
| Demographics | Rating | Rank | 5th Grade |
| Immigrants | Micronesia | 48.8 /100 | #175 | Average 97.3% |
| Immigrants | Taiwan | 48.4 /100 | #176 | Average 97.3% |
| Immigrants | Spain | 47.0 /100 | #177 | Average 97.3% |
| Comanche | 42.1 /100 | #178 | Average 97.3% |
| Immigrants | Kenya | 40.3 /100 | #179 | Average 97.3% |
| Pakistanis | 40.2 /100 | #180 | Average 97.3% |
| Argentineans | 39.5 /100 | #181 | Fair 97.3% |
| Mongolians | 39.4 /100 | #182 | Fair 97.3% |
| Immigrants | Ukraine | 38.6 /100 | #183 | Fair 97.3% |
| Immigrants | Venezuela | 38.4 /100 | #184 | Fair 97.3% |
| Dutch West Indians | 36.2 /100 | #185 | Fair 97.3% |
| Immigrants | Argentina | 36.1 /100 | #186 | Fair 97.3% |
| Spanish Americans | 34.7 /100 | #187 | Fair 97.3% |
| Paraguayans | 33.7 /100 | #188 | Fair 97.3% |
| Immigrants | Egypt | 32.9 /100 | #189 | Fair 97.3% |
Demographics Similar to Indians (Asian) by 5th Grade
In terms of 5th grade, the demographic groups most similar to Indians (Asian) are Asian (96.9%, a difference of 0.0%), Nigerian (96.9%, a difference of 0.0%), Immigrants from Indonesia (96.9%, a difference of 0.010%), Immigrants from Asia (96.9%, a difference of 0.010%), and Immigrants from Costa Rica (96.9%, a difference of 0.020%).
| Demographics | Rating | Rank | 5th Grade |
| Sub-Saharan Africans | 3.3 /100 | #233 | Tragic 97.0% |
| Tohono O'odham | 3.2 /100 | #234 | Tragic 97.0% |
| Uruguayans | 3.2 /100 | #235 | Tragic 97.0% |
| Senegalese | 2.8 /100 | #236 | Tragic 97.0% |
| Immigrants | Indonesia | 2.0 /100 | #237 | Tragic 96.9% |
| Asians | 2.0 /100 | #238 | Tragic 96.9% |
| Nigerians | 1.9 /100 | #239 | Tragic 96.9% |
| Indians (Asian) | 1.9 /100 | #240 | Tragic 96.9% |
| Immigrants | Asia | 1.7 /100 | #241 | Tragic 96.9% |
| Immigrants | Costa Rica | 1.6 /100 | #242 | Tragic 96.9% |
| Immigrants | Eastern Africa | 1.6 /100 | #243 | Tragic 96.9% |
| Koreans | 1.6 /100 | #244 | Tragic 96.9% |
| Colombians | 1.3 /100 | #245 | Tragic 96.9% |
| Ethiopians | 1.2 /100 | #246 | Tragic 96.9% |
| Immigrants | Africa | 1.1 /100 | #247 | Tragic 96.9% |