Immigrants from Egypt vs Czech 5th Grade
COMPARE
Immigrants from Egypt
Czech
5th Grade
5th Grade Comparison
Immigrants from Egypt
Czechs
97.3%
5TH GRADE
32.9/ 100
METRIC RATING
189th/ 347
METRIC RANK
98.2%
5TH GRADE
100.0/ 100
METRIC RATING
28th/ 347
METRIC RANK
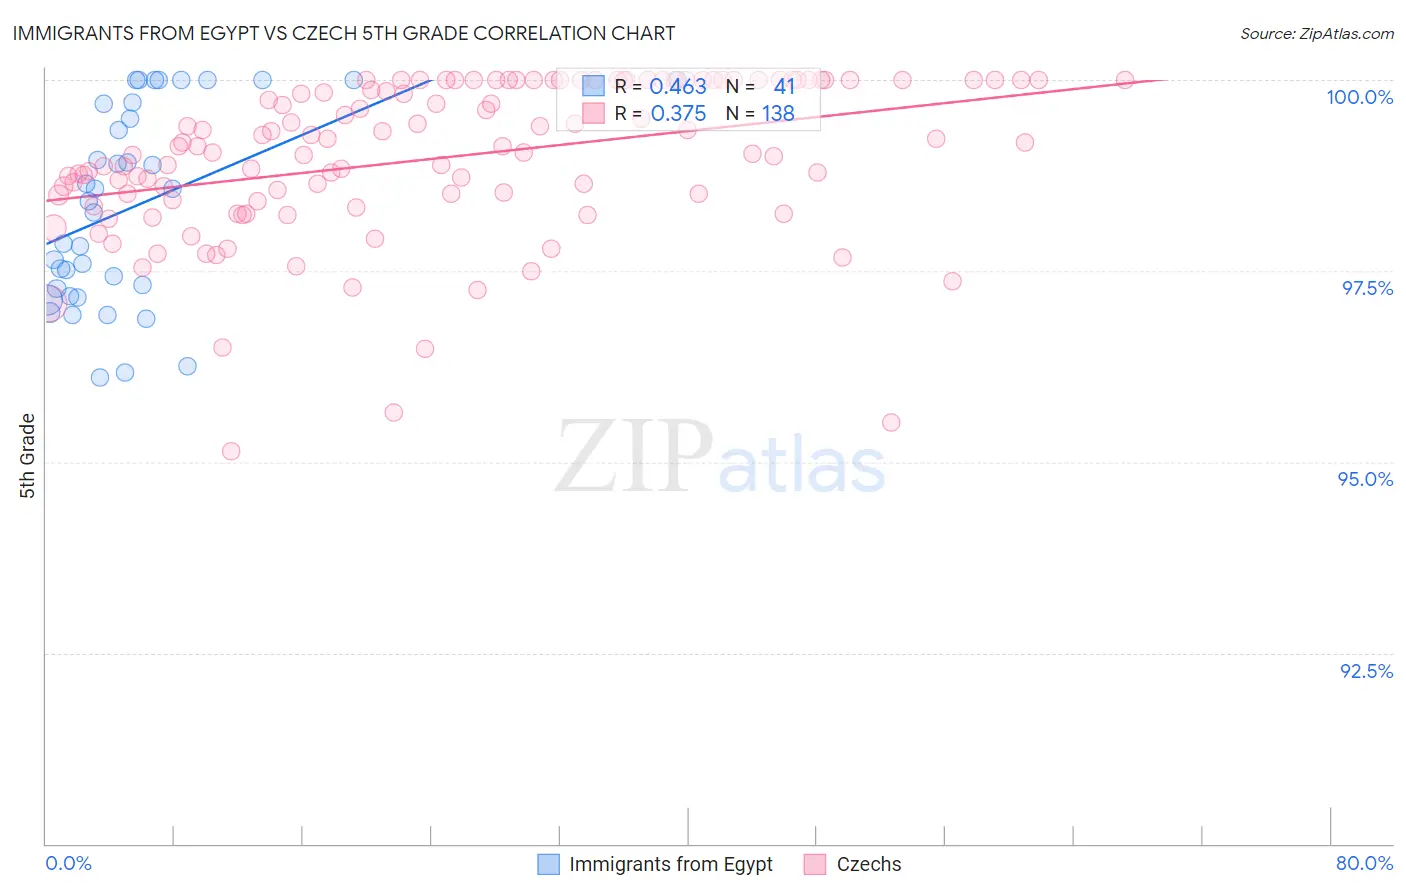
Immigrants from Egypt vs Czech 5th Grade Correlation Chart
The statistical analysis conducted on geographies consisting of 245,485,794 people shows a moderate positive correlation between the proportion of Immigrants from Egypt and percentage of population with at least 5th grade education in the United States with a correlation coefficient (R) of 0.463 and weighted average of 97.3%. Similarly, the statistical analysis conducted on geographies consisting of 484,805,686 people shows a mild positive correlation between the proportion of Czechs and percentage of population with at least 5th grade education in the United States with a correlation coefficient (R) of 0.375 and weighted average of 98.2%, a difference of 0.95%.
5th Grade Correlation Summary
| Measurement | Immigrants from Egypt | Czech |
| Minimum | 96.1% | 95.1% |
| Maximum | 100.0% | 100.0% |
| Range | 3.9% | 4.9% |
| Mean | 98.3% | 99.0% |
| Median | 98.4% | 99.1% |
| Interquartile 25% (IQ1) | 97.2% | 98.4% |
| Interquartile 75% (IQ3) | 99.7% | 100.0% |
| Interquartile Range (IQR) | 2.5% | 1.6% |
| Standard Deviation (Sample) | 1.3% | 1.0% |
| Standard Deviation (Population) | 1.3% | 1.0% |
Similar Demographics by 5th Grade
Demographics Similar to Immigrants from Egypt by 5th Grade
In terms of 5th grade, the demographic groups most similar to Immigrants from Egypt are Paraguayan (97.3%, a difference of 0.0%), Immigrants from Argentina (97.3%, a difference of 0.010%), Spanish American (97.3%, a difference of 0.010%), Black/African American (97.3%, a difference of 0.010%), and Immigrants from Brazil (97.3%, a difference of 0.010%).
| Demographics | Rating | Rank | 5th Grade |
| Mongolians | 39.4 /100 | #182 | Fair 97.3% |
| Immigrants | Ukraine | 38.6 /100 | #183 | Fair 97.3% |
| Immigrants | Venezuela | 38.4 /100 | #184 | Fair 97.3% |
| Dutch West Indians | 36.2 /100 | #185 | Fair 97.3% |
| Immigrants | Argentina | 36.1 /100 | #186 | Fair 97.3% |
| Spanish Americans | 34.7 /100 | #187 | Fair 97.3% |
| Paraguayans | 33.7 /100 | #188 | Fair 97.3% |
| Immigrants | Egypt | 32.9 /100 | #189 | Fair 97.3% |
| Blacks/African Americans | 31.8 /100 | #190 | Fair 97.3% |
| Immigrants | Brazil | 31.5 /100 | #191 | Fair 97.3% |
| Panamanians | 31.3 /100 | #192 | Fair 97.3% |
| Navajo | 29.0 /100 | #193 | Fair 97.2% |
| Immigrants | Albania | 28.5 /100 | #194 | Fair 97.2% |
| Guamanians/Chamorros | 26.8 /100 | #195 | Fair 97.2% |
| Hawaiians | 25.6 /100 | #196 | Fair 97.2% |
Demographics Similar to Czechs by 5th Grade
In terms of 5th grade, the demographic groups most similar to Czechs are French (98.2%, a difference of 0.0%), Yup'ik (98.2%, a difference of 0.010%), Alaska Native (98.2%, a difference of 0.010%), Scandinavian (98.2%, a difference of 0.010%), and French Canadian (98.2%, a difference of 0.010%).
| Demographics | Rating | Rank | 5th Grade |
| Danes | 100.0 /100 | #21 | Exceptional 98.2% |
| Croatians | 100.0 /100 | #22 | Exceptional 98.2% |
| Sioux | 100.0 /100 | #23 | Exceptional 98.2% |
| Scotch-Irish | 100.0 /100 | #24 | Exceptional 98.2% |
| Yup'ik | 100.0 /100 | #25 | Exceptional 98.2% |
| Alaska Natives | 100.0 /100 | #26 | Exceptional 98.2% |
| French | 100.0 /100 | #27 | Exceptional 98.2% |
| Czechs | 100.0 /100 | #28 | Exceptional 98.2% |
| Scandinavians | 100.0 /100 | #29 | Exceptional 98.2% |
| French Canadians | 100.0 /100 | #30 | Exceptional 98.2% |
| Europeans | 100.0 /100 | #31 | Exceptional 98.2% |
| Chippewa | 100.0 /100 | #32 | Exceptional 98.1% |
| Swiss | 100.0 /100 | #33 | Exceptional 98.1% |
| Chinese | 100.0 /100 | #34 | Exceptional 98.1% |
| Italians | 100.0 /100 | #35 | Exceptional 98.1% |