Immigrants from Egypt vs Czech Male Unemployment
COMPARE
Immigrants from Egypt
Czech
Male Unemployment
Male Unemployment Comparison
Immigrants from Egypt
Czechs
5.2%
MALE UNEMPLOYMENT
65.9/ 100
METRIC RATING
162nd/ 347
METRIC RANK
4.5%
MALE UNEMPLOYMENT
100.0/ 100
METRIC RATING
7th/ 347
METRIC RANK
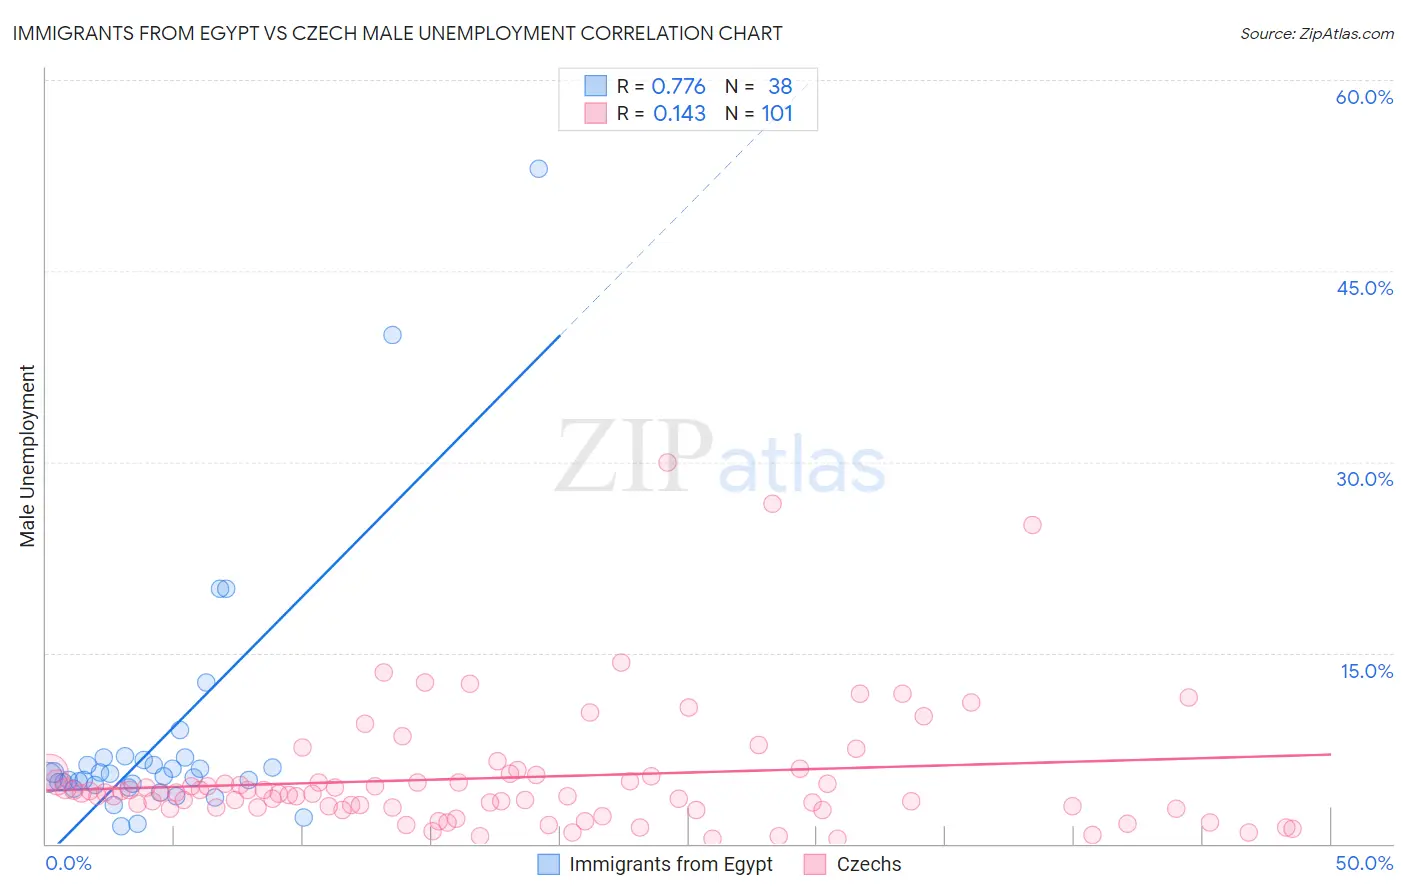
Immigrants from Egypt vs Czech Male Unemployment Correlation Chart
The statistical analysis conducted on geographies consisting of 245,171,994 people shows a strong positive correlation between the proportion of Immigrants from Egypt and unemployment rate among males in the United States with a correlation coefficient (R) of 0.776 and weighted average of 5.2%. Similarly, the statistical analysis conducted on geographies consisting of 479,698,612 people shows a poor positive correlation between the proportion of Czechs and unemployment rate among males in the United States with a correlation coefficient (R) of 0.143 and weighted average of 4.5%, a difference of 15.9%.
Male Unemployment Correlation Summary
| Measurement | Immigrants from Egypt | Czech |
| Minimum | 1.4% | 0.40% |
| Maximum | 53.0% | 30.0% |
| Range | 51.6% | 29.6% |
| Mean | 8.2% | 5.2% |
| Median | 5.3% | 4.0% |
| Interquartile 25% (IQ1) | 4.6% | 2.8% |
| Interquartile 75% (IQ3) | 6.6% | 5.4% |
| Interquartile Range (IQR) | 2.0% | 2.6% |
| Standard Deviation (Sample) | 10.0% | 5.0% |
| Standard Deviation (Population) | 9.9% | 5.0% |
Similar Demographics by Male Unemployment
Demographics Similar to Immigrants from Egypt by Male Unemployment
In terms of male unemployment, the demographic groups most similar to Immigrants from Egypt are Immigrants from Hong Kong (5.2%, a difference of 0.010%), Afghan (5.3%, a difference of 0.25%), Immigrants from China (5.2%, a difference of 0.32%), South American (5.3%, a difference of 0.33%), and Immigrants from Norway (5.2%, a difference of 0.35%).
| Demographics | Rating | Rank | Male Unemployment |
| Immigrants | Hungary | 73.4 /100 | #155 | Good 5.2% |
| Americans | 72.7 /100 | #156 | Good 5.2% |
| Immigrants | Northern Africa | 72.3 /100 | #157 | Good 5.2% |
| Immigrants | Indonesia | 71.5 /100 | #158 | Good 5.2% |
| Indonesians | 71.2 /100 | #159 | Good 5.2% |
| Immigrants | Norway | 71.0 /100 | #160 | Good 5.2% |
| Immigrants | China | 70.6 /100 | #161 | Good 5.2% |
| Immigrants | Egypt | 65.9 /100 | #162 | Good 5.2% |
| Immigrants | Hong Kong | 65.7 /100 | #163 | Good 5.2% |
| Afghans | 62.0 /100 | #164 | Good 5.3% |
| South Americans | 60.6 /100 | #165 | Good 5.3% |
| Immigrants | Morocco | 60.2 /100 | #166 | Good 5.3% |
| Immigrants | Vietnam | 58.1 /100 | #167 | Average 5.3% |
| Immigrants | Ireland | 57.7 /100 | #168 | Average 5.3% |
| Immigrants | Congo | 57.4 /100 | #169 | Average 5.3% |
Demographics Similar to Czechs by Male Unemployment
In terms of male unemployment, the demographic groups most similar to Czechs are Venezuelan (4.5%, a difference of 0.20%), Luxembourger (4.5%, a difference of 0.26%), Danish (4.5%, a difference of 0.65%), Thai (4.6%, a difference of 1.5%), and Immigrants from Venezuela (4.4%, a difference of 1.7%).
| Demographics | Rating | Rank | Male Unemployment |
| Immigrants | India | 100.0 /100 | #1 | Exceptional 4.4% |
| Immigrants | Cuba | 100.0 /100 | #2 | Exceptional 4.4% |
| Norwegians | 100.0 /100 | #3 | Exceptional 4.4% |
| Immigrants | Venezuela | 100.0 /100 | #4 | Exceptional 4.4% |
| Danes | 100.0 /100 | #5 | Exceptional 4.5% |
| Venezuelans | 100.0 /100 | #6 | Exceptional 4.5% |
| Czechs | 100.0 /100 | #7 | Exceptional 4.5% |
| Luxembourgers | 100.0 /100 | #8 | Exceptional 4.5% |
| Thais | 100.0 /100 | #9 | Exceptional 4.6% |
| Cubans | 100.0 /100 | #10 | Exceptional 4.6% |
| Swedes | 100.0 /100 | #11 | Exceptional 4.6% |
| Immigrants | Bolivia | 100.0 /100 | #12 | Exceptional 4.7% |
| Bolivians | 100.0 /100 | #13 | Exceptional 4.7% |
| Germans | 100.0 /100 | #14 | Exceptional 4.7% |
| Scandinavians | 100.0 /100 | #15 | Exceptional 4.7% |