Albanian vs Czech 5th Grade

COMPARE

Albanian
Race
Ancestry
AfghanAfricanAlaska NativeAlaskan AthabascanAlbanianAleutAlsatianAmericanApacheArabArapahoArgentineanArmenianAssyrian/Chaldean/SyriacAustralianAustrianBahamianBangladeshiBarbadianBasqueBelgianBelizeanBermudanBhutaneseBlackfeetBolivianBrazilianBritishBritish West IndianBulgarianBurmeseCajunCambodianCanadianCape VerdeanCarpatho RusynCelticCentral AmericanCentral American IndianCherokeeCheyenneChickasawChileanChineseChippewaChoctawColombianColvilleComancheCosta RicanCreeCreekCroatianCrowCubanCypriotCzechoslovakianDanishDelawareDominicanDutchDutch West IndianEastern EuropeanEcuadorianEgyptianEnglishEstonianEthiopianEuropeanFijianFilipinoFinnishFrenchFrench American IndianFrench CanadianGermanGerman RussianGhanaianGreekGuamanian/ChamorroGuatemalanGuyaneseHaitianHmongHonduranHopiHoumaHungarianIcelanderIndian (Asian)IndonesianInupiatIranianIraqiIrishIroquoisIsraeliItalianJamaicanJapaneseJordanianKenyanKiowaKoreanLaotianLatvianLebaneseLiberianLithuanianLumbeeLuxembourgerMacedonianMalaysianMalteseMarshalleseMenomineeMexicanMexican American IndianMongolianMoroccanNative HawaiianNavajoNepaleseNew ZealanderNicaraguanNigerianNorthern EuropeanNorwegianOkinawanOsageOttawaPaiutePakistaniPalestinianPanamanianParaguayanPennsylvania GermanPeruvianPimaPolishPortuguesePotawatomiPuebloPuerto RicanPuget Sound SalishRomanianRussianSalvadoranSamoanScandinavianScotch-IrishScottishSeminoleSenegaleseSerbianShoshoneSierra LeoneanSiouxSlavicSlovakSloveneSomaliSouth AfricanSouth AmericanSouth American IndianSoviet UnionSpaniardSpanishSpanish AmericanSpanish American IndianSri LankanSubsaharan AfricanSudaneseSwedishSwissSyrianTaiwaneseThaiTlingit-HaidaTohono O'OdhamTonganTrinidadian and TobagonianTsimshianTurkishU.S. Virgin IslanderUgandanUkrainianUruguayanUteVenezuelanVietnameseWelshWest IndianYakamaYaquiYugoslavianYumanYup'ikZimbabwean
Immigration
NonimmigrantsImmigrantsAfghanistanAfricaAlbaniaArgentinaArmeniaAsiaAustraliaAustriaBahamasBangladeshBarbadosBelarusBelgiumBelizeBoliviaBosnia and HerzegovinaBrazilBulgariaBurma/MyanmarCabo VerdeCambodiaCameroonCanadaCaribbeanCentral AmericaChileChinaColombiaCongoCosta RicaCroatiaCubaCzechoslovakiaDenmarkDominicaDominican RepublicEastern AfricaEastern AsiaEastern EuropeEcuadorEgyptEl SalvadorEnglandEritreaEthiopiaEuropeFijiFranceGermanyGhanaGreeceGrenadaGuatemalaGuyanaHaitiHondurasHong KongHungaryIndiaIndonesiaIranIraqIrelandIsraelItalyJamaicaJapanJordanKazakhstanKenyaKoreaKuwaitLaosLatin AmericaLatviaLebanonLiberiaLithuaniaMalaysiaMexicoMicronesiaMiddle AfricaMoldovaMoroccoNepalNetherlandsNicaraguaNigeriaNorth AmericaNorth MacedoniaNorthern AfricaNorthern EuropeNorwayOceaniaPakistanPanamaPeruPhilippinesPolandPortugalRomaniaRussiaSaudi ArabiaScotlandSenegalSerbiaSierra LeoneSingaporeSomaliaSouth AfricaSouth AmericaSouth Central AsiaSouth Eastern AsiaSouthern EuropeSpainSri LankaSt. Vincent and the GrenadinesSudanSwedenSwitzerlandSyriaTaiwanThailandTrinidad and TobagoTurkeyUgandaUkraineUruguayUzbekistanVenezuelaVietnamWest IndiesWestern AfricaWestern AsiaWestern EuropeYemenZaireZimbabweAzores
Czech
Race
Ancestry
AfghanAfricanAlaska NativeAlaskan AthabascanAleutAlsatianAmericanApacheArabArapahoArgentineanArmenianAssyrian/Chaldean/SyriacAustralianAustrianBahamianBangladeshiBarbadianBasqueBelgianBelizeanBermudanBhutaneseBlackfeetBolivianBrazilianBritishBritish West IndianBulgarianBurmeseCajunCambodianCanadianCape VerdeanCarpatho RusynCelticCentral AmericanCentral American IndianCherokeeCheyenneChickasawChileanChineseChippewaChoctawColombianColvilleComancheCosta RicanCreeCreekCroatianCrowCubanCypriotCzechCzechoslovakianDanishDelawareDominicanDutchDutch West IndianEastern EuropeanEcuadorianEgyptianEnglishEstonianEthiopianEuropeanFijianFilipinoFinnishFrenchFrench American IndianFrench CanadianGermanGerman RussianGhanaianGreekGuamanian/ChamorroGuatemalanGuyaneseHaitianHmongHonduranHopiHoumaHungarianIcelanderIndian (Asian)IndonesianInupiatIranianIraqiIrishIroquoisIsraeliItalianJamaicanJapaneseJordanianKenyanKiowaKoreanLaotianLatvianLebaneseLiberianLithuanianLumbeeLuxembourgerMacedonianMalaysianMalteseMarshalleseMenomineeMexicanMexican American IndianMongolianMoroccanNative HawaiianNavajoNepaleseNew ZealanderNicaraguanNigerianNorthern EuropeanNorwegianOkinawanOsageOttawaPaiutePakistaniPalestinianPanamanianParaguayanPennsylvania GermanPeruvianPimaPolishPortuguesePotawatomiPuebloPuerto RicanPuget Sound SalishRomanianRussianSalvadoranSamoanScandinavianScotch-IrishScottishSeminoleSenegaleseSerbianShoshoneSierra LeoneanSiouxSlavicSlovakSloveneSomaliSouth AfricanSouth AmericanSouth American IndianSoviet UnionSpaniardSpanishSpanish AmericanSpanish American IndianSri LankanSubsaharan AfricanSudaneseSwedishSwissSyrianTaiwaneseThaiTlingit-HaidaTohono O'OdhamTonganTrinidadian and TobagonianTsimshianTurkishU.S. Virgin IslanderUgandanUkrainianUruguayanUteVenezuelanVietnameseWelshWest IndianYakamaYaquiYugoslavianYumanYup'ikZimbabwean
Immigration
NonimmigrantsImmigrantsAfghanistanAfricaAlbaniaArgentinaArmeniaAsiaAustraliaAustriaBahamasBangladeshBarbadosBelarusBelgiumBelizeBoliviaBosnia and HerzegovinaBrazilBulgariaBurma/MyanmarCabo VerdeCambodiaCameroonCanadaCaribbeanCentral AmericaChileChinaColombiaCongoCosta RicaCroatiaCubaCzechoslovakiaDenmarkDominicaDominican RepublicEastern AfricaEastern AsiaEastern EuropeEcuadorEgyptEl SalvadorEnglandEritreaEthiopiaEuropeFijiFranceGermanyGhanaGreeceGrenadaGuatemalaGuyanaHaitiHondurasHong KongHungaryIndiaIndonesiaIranIraqIrelandIsraelItalyJamaicaJapanJordanKazakhstanKenyaKoreaKuwaitLaosLatin AmericaLatviaLebanonLiberiaLithuaniaMalaysiaMexicoMicronesiaMiddle AfricaMoldovaMoroccoNepalNetherlandsNicaraguaNigeriaNorth AmericaNorth MacedoniaNorthern AfricaNorthern EuropeNorwayOceaniaPakistanPanamaPeruPhilippinesPolandPortugalRomaniaRussiaSaudi ArabiaScotlandSenegalSerbiaSierra LeoneSingaporeSomaliaSouth AfricaSouth AmericaSouth Central AsiaSouth Eastern AsiaSouthern EuropeSpainSri LankaSt. Vincent and the GrenadinesSudanSwedenSwitzerlandSyriaTaiwanThailandTrinidad and TobagoTurkeyUgandaUkraineUruguayUzbekistanVenezuelaVietnamWest IndiesWestern AfricaWestern AsiaWestern EuropeYemenZaireZimbabweAzores
5th Grade
Income
Poverty
Unemployment
Labor Participation
Family Structure
Vehicle Availability
Education Level
Disability

5th Grade Comparison

Albanians

Czechs

Good
Exceptional
97.4%
5TH GRADE
68.3/ 100
METRIC RATING
158th/ 347
METRIC RANK
98.2%
5TH GRADE
100.0/ 100
METRIC RATING
28th/ 347
METRIC RANK

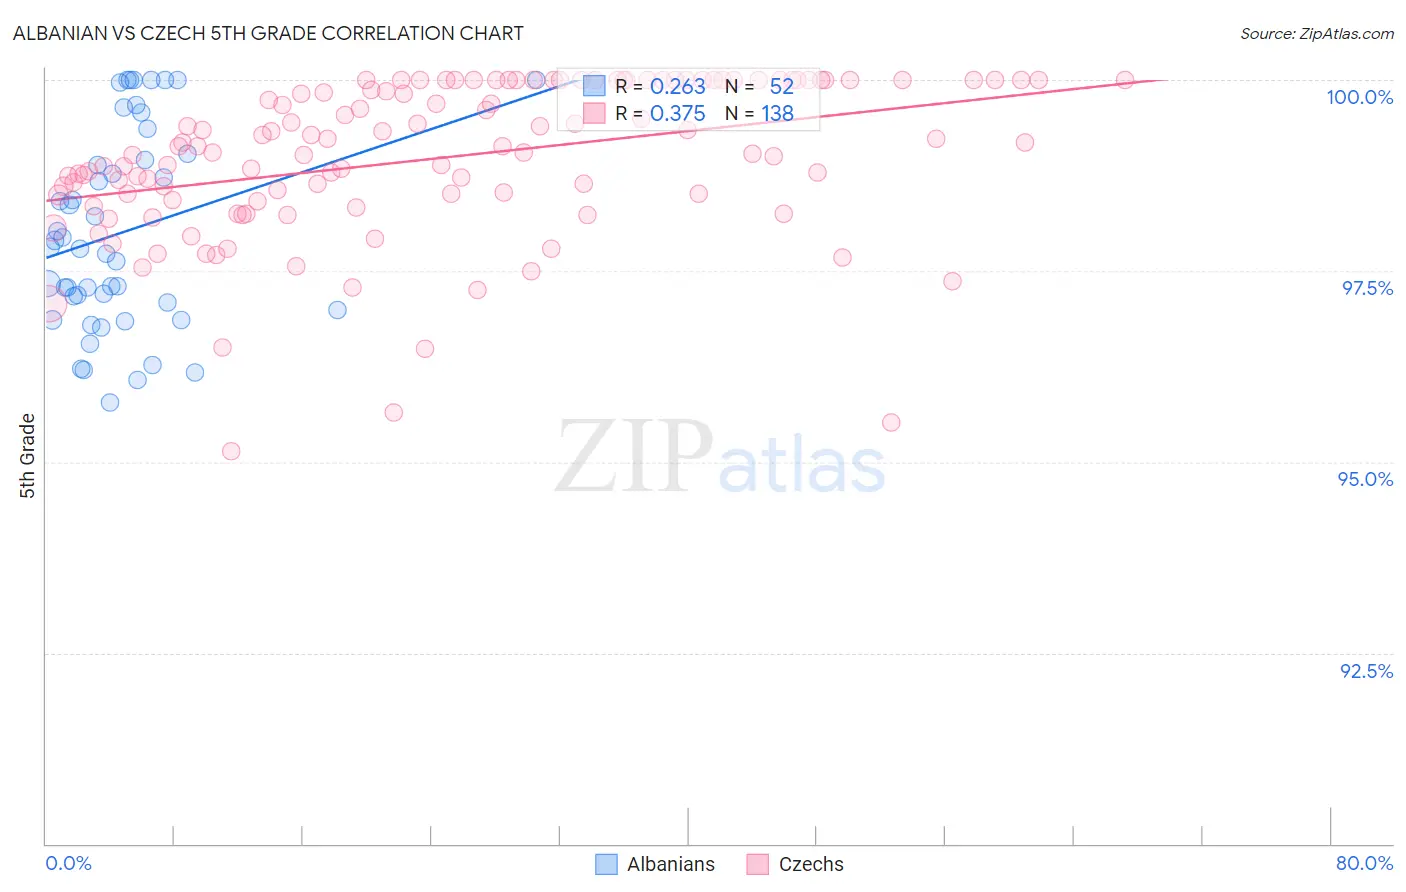
Albanian vs Czech 5th Grade Correlation Chart

The statistical analysis conducted on geographies consisting of 193,265,850 people shows a weak positive correlation between the proportion of Albanians and percentage of population with at least 5th grade education in the United States with a correlation coefficient (R) of 0.263 and weighted average of 97.4%. Similarly, the statistical analysis conducted on geographies consisting of 484,805,686 people shows a mild positive correlation between the proportion of Czechs and percentage of population with at least 5th grade education in the United States with a correlation coefficient (R) of 0.375 and weighted average of 98.2%, a difference of 0.79%.
Albanian vs Czech 5th Grade

5th Grade Correlation Summary

MeasurementAlbanianCzech
Minimum95.8%95.1%
Maximum100.0%100.0%
Range4.2%4.9%
Mean98.0%99.0%
Median97.8%99.1%
Interquartile 25% (IQ1)97.0%98.4%
Interquartile 75% (IQ3)99.0%100.0%
Interquartile Range (IQR)2.0%1.6%
Standard Deviation (Sample)1.3%1.0%
Standard Deviation (Population)1.3%1.0%

Similar Demographics by 5th Grade

Demographics Similar to Albanians by 5th Grade

In terms of 5th grade, the demographic groups most similar to Albanians are Immigrants from Russia (97.4%, a difference of 0.010%), Immigrants from Bosnia and Herzegovina (97.4%, a difference of 0.010%), French American Indian (97.4%, a difference of 0.010%), Immigrants from Jordan (97.4%, a difference of 0.010%), and Immigrants from Italy (97.4%, a difference of 0.010%).
DemographicsRating | Rank5th Grade
Immigrants | Eastern Europe
75.0
/100
|
#151
Good
97.4%
Ute
74.9
/100
|
#152
Good
97.4%
Alsatians
74.3
/100
|
#153
Good
97.4%
Immigrants | Russia
71.2
/100
|
#154
Good
97.4%
Immigrants | Bosnia and Herzegovina
71.0
/100
|
#155
Good
97.4%
French American Indians
70.5
/100
|
#156
Good
97.4%
Immigrants | Jordan
70.4
/100
|
#157
Good
97.4%
Albanians
68.3
/100
|
#158
Good
97.4%
Immigrants | Italy
65.2
/100
|
#159
Good
97.4%
Marshallese
61.2
/100
|
#160
Good
97.4%
Kenyans
59.7
/100
|
#161
Average
97.4%
Immigrants | Iran
59.5
/100
|
#162
Average
97.4%
Ugandans
58.9
/100
|
#163
Average
97.4%
Bermudans
58.8
/100
|
#164
Average
97.4%
Immigrants | Poland
57.9
/100
|
#165
Average
97.4%

Demographics Similar to Czechs by 5th Grade

In terms of 5th grade, the demographic groups most similar to Czechs are French (98.2%, a difference of 0.0%), Yup'ik (98.2%, a difference of 0.010%), Alaska Native (98.2%, a difference of 0.010%), Scandinavian (98.2%, a difference of 0.010%), and French Canadian (98.2%, a difference of 0.010%).
DemographicsRating | Rank5th Grade
Danes
100.0
/100
|
#21
Exceptional
98.2%
Croatians
100.0
/100
|
#22
Exceptional
98.2%
Sioux
100.0
/100
|
#23
Exceptional
98.2%
Scotch-Irish
100.0
/100
|
#24
Exceptional
98.2%
Yup'ik
100.0
/100
|
#25
Exceptional
98.2%
Alaska Natives
100.0
/100
|
#26
Exceptional
98.2%
French
100.0
/100
|
#27
Exceptional
98.2%
Czechs
100.0
/100
|
#28
Exceptional
98.2%
Scandinavians
100.0
/100
|
#29
Exceptional
98.2%
French Canadians
100.0
/100
|
#30
Exceptional
98.2%
Europeans
100.0
/100
|
#31
Exceptional
98.2%
Chippewa
100.0
/100
|
#32
Exceptional
98.1%
Swiss
100.0
/100
|
#33
Exceptional
98.1%
Chinese
100.0
/100
|
#34
Exceptional
98.1%
Italians
100.0
/100
|
#35
Exceptional
98.1%