Immigrants from Ecuador vs Cherokee Professional Degree
COMPARE
Immigrants from Ecuador
Cherokee
Professional Degree
Professional Degree Comparison
Immigrants from Ecuador
Cherokee
3.8%
PROFESSIONAL DEGREE
2.3/ 100
METRIC RATING
240th/ 347
METRIC RANK
3.3%
PROFESSIONAL DEGREE
0.1/ 100
METRIC RATING
311th/ 347
METRIC RANK
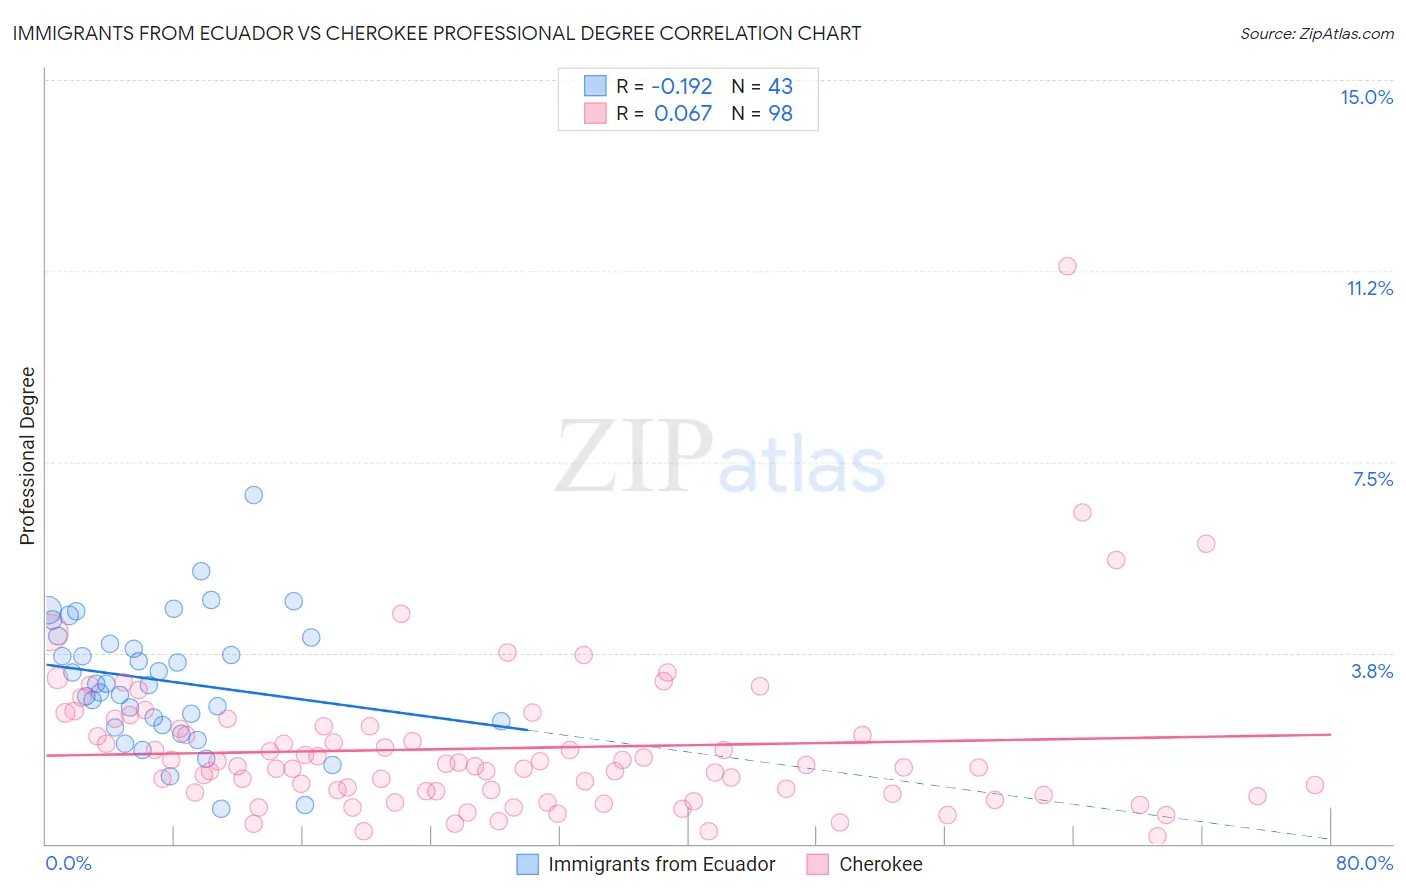
Immigrants from Ecuador vs Cherokee Professional Degree Correlation Chart
The statistical analysis conducted on geographies consisting of 270,711,574 people shows a poor negative correlation between the proportion of Immigrants from Ecuador and percentage of population with at least professional degree education in the United States with a correlation coefficient (R) of -0.192 and weighted average of 3.8%. Similarly, the statistical analysis conducted on geographies consisting of 489,212,297 people shows a slight positive correlation between the proportion of Cherokee and percentage of population with at least professional degree education in the United States with a correlation coefficient (R) of 0.067 and weighted average of 3.3%, a difference of 15.5%.
Professional Degree Correlation Summary
| Measurement | Immigrants from Ecuador | Cherokee |
| Minimum | 0.70% | 0.14% |
| Maximum | 6.9% | 11.3% |
| Range | 6.2% | 11.2% |
| Mean | 3.2% | 1.9% |
| Median | 3.1% | 1.5% |
| Interquartile 25% (IQ1) | 2.3% | 1.0% |
| Interquartile 75% (IQ3) | 4.1% | 2.3% |
| Interquartile Range (IQR) | 1.7% | 1.3% |
| Standard Deviation (Sample) | 1.3% | 1.5% |
| Standard Deviation (Population) | 1.2% | 1.5% |
Similar Demographics by Professional Degree
Demographics Similar to Immigrants from Ecuador by Professional Degree
In terms of professional degree, the demographic groups most similar to Immigrants from Ecuador are Alaskan Athabascan (3.8%, a difference of 0.020%), Native Hawaiian (3.8%, a difference of 0.020%), Guamanian/Chamorro (3.8%, a difference of 0.10%), British West Indian (3.8%, a difference of 0.23%), and Immigrants from Bahamas (3.8%, a difference of 0.53%).
| Demographics | Rating | Rank | Professional Degree |
| Immigrants | Philippines | 4.1 /100 | #233 | Tragic 3.9% |
| Immigrants | Nonimmigrants | 4.0 /100 | #234 | Tragic 3.9% |
| Immigrants | Barbados | 4.0 /100 | #235 | Tragic 3.9% |
| Spanish Americans | 3.8 /100 | #236 | Tragic 3.9% |
| Immigrants | Trinidad and Tobago | 3.8 /100 | #237 | Tragic 3.9% |
| Colville | 2.6 /100 | #238 | Tragic 3.8% |
| British West Indians | 2.4 /100 | #239 | Tragic 3.8% |
| Immigrants | Ecuador | 2.3 /100 | #240 | Tragic 3.8% |
| Alaskan Athabascans | 2.3 /100 | #241 | Tragic 3.8% |
| Native Hawaiians | 2.3 /100 | #242 | Tragic 3.8% |
| Guamanians/Chamorros | 2.2 /100 | #243 | Tragic 3.8% |
| Immigrants | Bahamas | 2.0 /100 | #244 | Tragic 3.8% |
| French American Indians | 1.7 /100 | #245 | Tragic 3.8% |
| Marshallese | 1.7 /100 | #246 | Tragic 3.8% |
| Guyanese | 1.6 /100 | #247 | Tragic 3.8% |
Demographics Similar to Cherokee by Professional Degree
In terms of professional degree, the demographic groups most similar to Cherokee are Immigrants from Latin America (3.3%, a difference of 0.15%), Pima (3.3%, a difference of 0.47%), Shoshone (3.3%, a difference of 0.48%), Sioux (3.3%, a difference of 0.59%), and Yuman (3.3%, a difference of 0.60%).
| Demographics | Rating | Rank | Professional Degree |
| Cajuns | 0.2 /100 | #304 | Tragic 3.4% |
| Chickasaw | 0.1 /100 | #305 | Tragic 3.4% |
| Cape Verdeans | 0.1 /100 | #306 | Tragic 3.4% |
| Samoans | 0.1 /100 | #307 | Tragic 3.3% |
| Shoshone | 0.1 /100 | #308 | Tragic 3.3% |
| Pima | 0.1 /100 | #309 | Tragic 3.3% |
| Immigrants | Latin America | 0.1 /100 | #310 | Tragic 3.3% |
| Cherokee | 0.1 /100 | #311 | Tragic 3.3% |
| Sioux | 0.1 /100 | #312 | Tragic 3.3% |
| Yuman | 0.1 /100 | #313 | Tragic 3.3% |
| Mexican American Indians | 0.1 /100 | #314 | Tragic 3.3% |
| Immigrants | Laos | 0.1 /100 | #315 | Tragic 3.2% |
| Puerto Ricans | 0.1 /100 | #316 | Tragic 3.2% |
| Nepalese | 0.1 /100 | #317 | Tragic 3.2% |
| Immigrants | Micronesia | 0.1 /100 | #318 | Tragic 3.2% |