Immigrants from Germany vs Egyptian Master's Degree
COMPARE
Immigrants from Germany
Egyptian
Master's Degree
Master's Degree Comparison
Immigrants from Germany
Egyptians
15.8%
MASTER'S DEGREE
85.9/ 100
METRIC RATING
139th/ 347
METRIC RANK
17.6%
MASTER'S DEGREE
99.6/ 100
METRIC RATING
75th/ 347
METRIC RANK
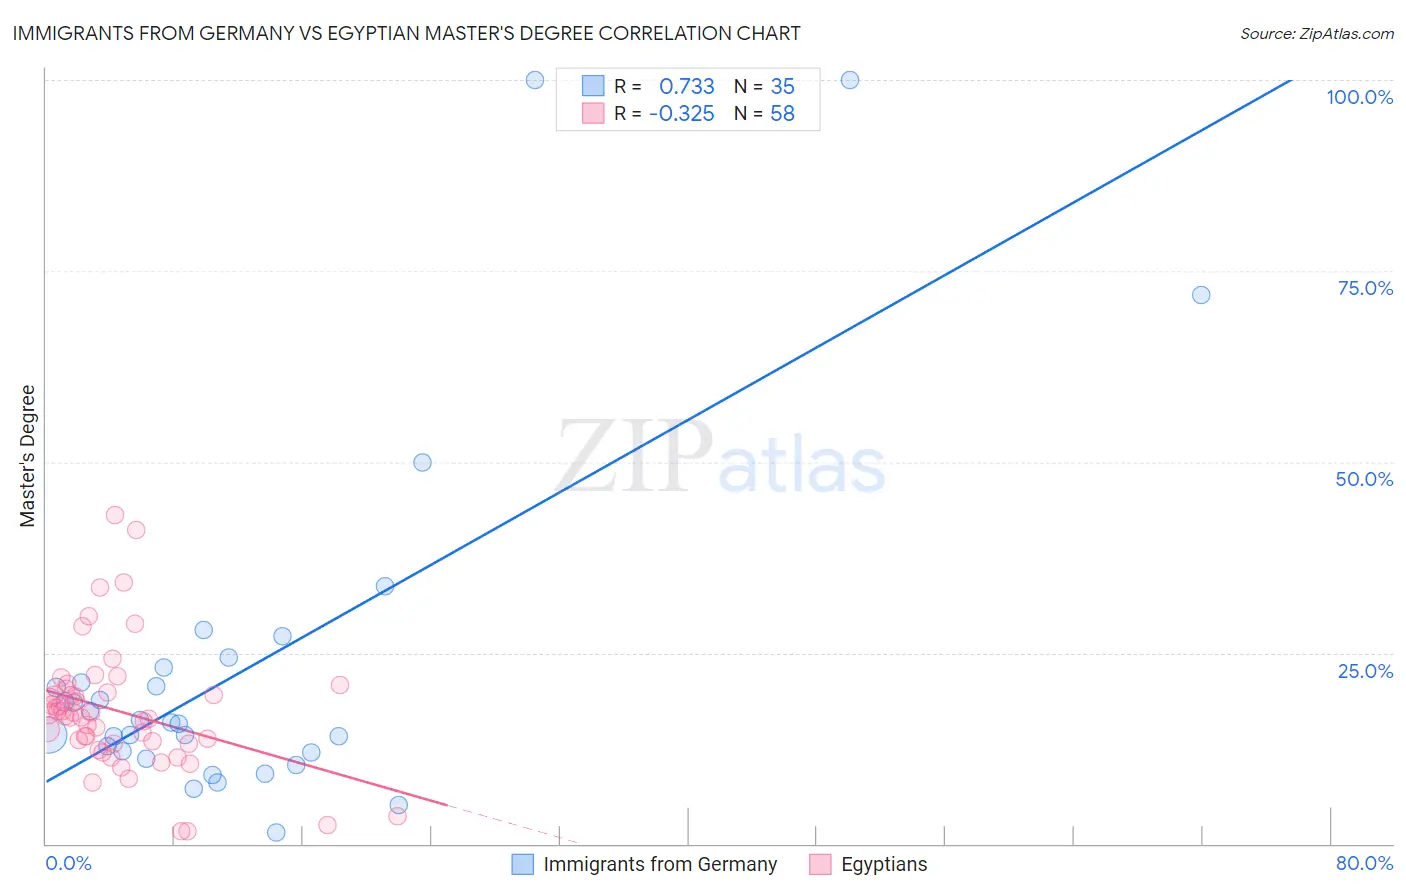
Immigrants from Germany vs Egyptian Master's Degree Correlation Chart
The statistical analysis conducted on geographies consisting of 463,768,587 people shows a strong positive correlation between the proportion of Immigrants from Germany and percentage of population with at least master's degree education in the United States with a correlation coefficient (R) of 0.733 and weighted average of 15.8%. Similarly, the statistical analysis conducted on geographies consisting of 276,863,578 people shows a mild negative correlation between the proportion of Egyptians and percentage of population with at least master's degree education in the United States with a correlation coefficient (R) of -0.325 and weighted average of 17.6%, a difference of 11.5%.
Master's Degree Correlation Summary
| Measurement | Immigrants from Germany | Egyptian |
| Minimum | 1.5% | 1.6% |
| Maximum | 100.0% | 43.1% |
| Range | 98.5% | 41.4% |
| Mean | 23.2% | 17.4% |
| Median | 15.9% | 16.9% |
| Interquartile 25% (IQ1) | 11.9% | 13.2% |
| Interquartile 75% (IQ3) | 23.0% | 19.9% |
| Interquartile Range (IQR) | 11.1% | 6.7% |
| Standard Deviation (Sample) | 23.1% | 8.2% |
| Standard Deviation (Population) | 22.7% | 8.1% |
Similar Demographics by Master's Degree
Demographics Similar to Immigrants from Germany by Master's Degree
In terms of master's degree, the demographic groups most similar to Immigrants from Germany are Pakistani (15.8%, a difference of 0.060%), Vietnamese (15.8%, a difference of 0.090%), European (15.8%, a difference of 0.14%), Polish (15.7%, a difference of 0.21%), and Assyrian/Chaldean/Syriac (15.8%, a difference of 0.24%).
| Demographics | Rating | Rank | Master's Degree |
| Serbians | 91.7 /100 | #132 | Exceptional 16.1% |
| Immigrants | Sudan | 90.2 /100 | #133 | Exceptional 16.0% |
| Venezuelans | 88.4 /100 | #134 | Excellent 15.9% |
| South American Indians | 88.4 /100 | #135 | Excellent 15.9% |
| Assyrians/Chaldeans/Syriacs | 86.8 /100 | #136 | Excellent 15.8% |
| Europeans | 86.4 /100 | #137 | Excellent 15.8% |
| Pakistanis | 86.1 /100 | #138 | Excellent 15.8% |
| Immigrants | Germany | 85.9 /100 | #139 | Excellent 15.8% |
| Vietnamese | 85.5 /100 | #140 | Excellent 15.8% |
| Poles | 85.0 /100 | #141 | Excellent 15.7% |
| Immigrants | Africa | 84.0 /100 | #142 | Excellent 15.7% |
| Immigrants | Venezuela | 83.6 /100 | #143 | Excellent 15.7% |
| Canadians | 83.3 /100 | #144 | Excellent 15.7% |
| South Americans | 81.3 /100 | #145 | Excellent 15.6% |
| Immigrants | Afghanistan | 79.4 /100 | #146 | Good 15.6% |
Demographics Similar to Egyptians by Master's Degree
In terms of master's degree, the demographic groups most similar to Egyptians are Immigrants from Indonesia (17.6%, a difference of 0.030%), Immigrants from Eastern Europe (17.6%, a difference of 0.14%), Immigrants from Hungary (17.5%, a difference of 0.34%), Immigrants from Romania (17.7%, a difference of 0.38%), and Immigrants from Lebanon (17.5%, a difference of 0.47%).
| Demographics | Rating | Rank | Master's Degree |
| Immigrants | Ethiopia | 99.8 /100 | #68 | Exceptional 17.9% |
| Immigrants | Uzbekistan | 99.8 /100 | #69 | Exceptional 17.9% |
| Immigrants | Western Europe | 99.8 /100 | #70 | Exceptional 17.8% |
| Immigrants | Pakistan | 99.7 /100 | #71 | Exceptional 17.8% |
| Lithuanians | 99.7 /100 | #72 | Exceptional 17.7% |
| Zimbabweans | 99.7 /100 | #73 | Exceptional 17.7% |
| Immigrants | Romania | 99.7 /100 | #74 | Exceptional 17.7% |
| Egyptians | 99.6 /100 | #75 | Exceptional 17.6% |
| Immigrants | Indonesia | 99.6 /100 | #76 | Exceptional 17.6% |
| Immigrants | Eastern Europe | 99.6 /100 | #77 | Exceptional 17.6% |
| Immigrants | Hungary | 99.6 /100 | #78 | Exceptional 17.5% |
| Immigrants | Lebanon | 99.6 /100 | #79 | Exceptional 17.5% |
| Carpatho Rusyns | 99.6 /100 | #80 | Exceptional 17.5% |
| Immigrants | Western Asia | 99.5 /100 | #81 | Exceptional 17.5% |
| Greeks | 99.5 /100 | #82 | Exceptional 17.5% |