Immigrants from Eastern Asia vs Panamanian Unemployment Among Women with Children Under 18 years
COMPARE
Immigrants from Eastern Asia
Panamanian
Unemployment Among Women with Children Under 18 years
Unemployment Among Women with Children Under 18 years Comparison
Immigrants from Eastern Asia
Panamanians
4.9%
UNEMPLOYMENT AMONG WOMEN WITH CHILDREN UNDER 18 YEARS
99.5/ 100
METRIC RATING
28th/ 347
METRIC RANK
5.7%
UNEMPLOYMENT AMONG WOMEN WITH CHILDREN UNDER 18 YEARS
10.1/ 100
METRIC RATING
211th/ 347
METRIC RANK
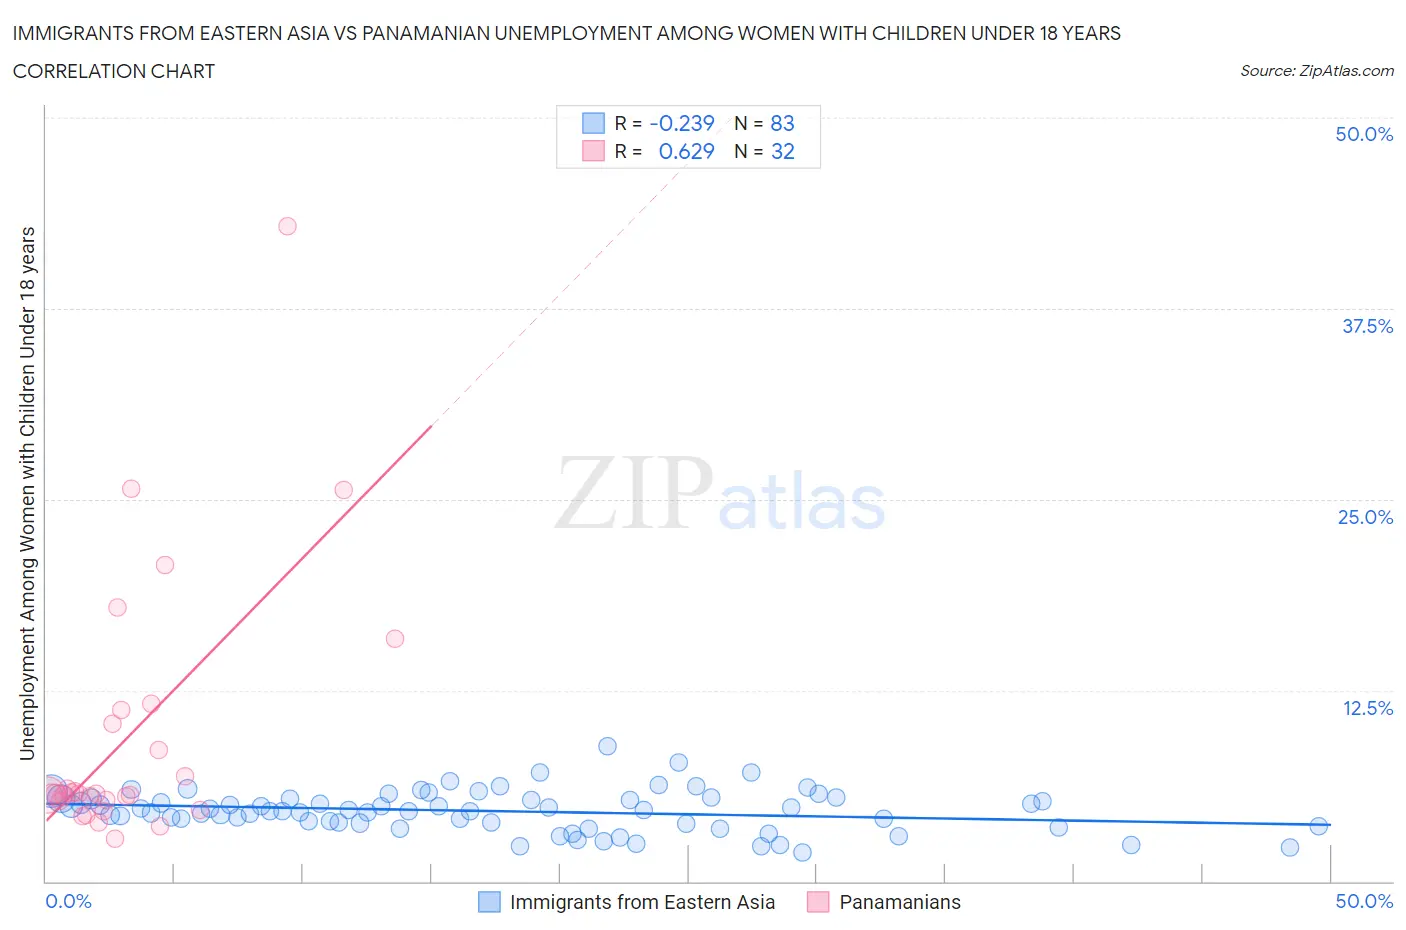
Immigrants from Eastern Asia vs Panamanian Unemployment Among Women with Children Under 18 years Correlation Chart
The statistical analysis conducted on geographies consisting of 470,021,238 people shows a weak negative correlation between the proportion of Immigrants from Eastern Asia and unemployment rate among women with children under the age of 18 in the United States with a correlation coefficient (R) of -0.239 and weighted average of 4.9%. Similarly, the statistical analysis conducted on geographies consisting of 275,323,843 people shows a significant positive correlation between the proportion of Panamanians and unemployment rate among women with children under the age of 18 in the United States with a correlation coefficient (R) of 0.629 and weighted average of 5.7%, a difference of 14.4%.
Unemployment Among Women with Children Under 18 years Correlation Summary
| Measurement | Immigrants from Eastern Asia | Panamanian |
| Minimum | 1.9% | 2.8% |
| Maximum | 8.8% | 42.9% |
| Range | 6.9% | 40.1% |
| Mean | 4.6% | 9.5% |
| Median | 4.6% | 5.7% |
| Interquartile 25% (IQ1) | 3.8% | 5.3% |
| Interquartile 75% (IQ3) | 5.4% | 10.7% |
| Interquartile Range (IQR) | 1.6% | 5.5% |
| Standard Deviation (Sample) | 1.3% | 8.6% |
| Standard Deviation (Population) | 1.3% | 8.5% |
Similar Demographics by Unemployment Among Women with Children Under 18 years
Demographics Similar to Immigrants from Eastern Asia by Unemployment Among Women with Children Under 18 years
In terms of unemployment among women with children under 18 years, the demographic groups most similar to Immigrants from Eastern Asia are Finnish (4.9%, a difference of 0.050%), Burmese (4.9%, a difference of 0.12%), Soviet Union (4.9%, a difference of 0.16%), Swiss (4.9%, a difference of 0.23%), and Chinese (4.9%, a difference of 0.34%).
| Demographics | Rating | Rank | Unemployment Among Women with Children Under 18 years |
| Europeans | 99.6 /100 | #21 | Exceptional 4.9% |
| Indians (Asian) | 99.6 /100 | #22 | Exceptional 4.9% |
| Immigrants | China | 99.6 /100 | #23 | Exceptional 4.9% |
| Belgians | 99.5 /100 | #24 | Exceptional 4.9% |
| Chinese | 99.5 /100 | #25 | Exceptional 4.9% |
| Swiss | 99.5 /100 | #26 | Exceptional 4.9% |
| Soviet Union | 99.5 /100 | #27 | Exceptional 4.9% |
| Immigrants | Eastern Asia | 99.5 /100 | #28 | Exceptional 4.9% |
| Finns | 99.4 /100 | #29 | Exceptional 4.9% |
| Burmese | 99.4 /100 | #30 | Exceptional 4.9% |
| Cypriots | 99.3 /100 | #31 | Exceptional 5.0% |
| Dutch | 99.3 /100 | #32 | Exceptional 5.0% |
| Croatians | 99.3 /100 | #33 | Exceptional 5.0% |
| Immigrants | South Central Asia | 99.2 /100 | #34 | Exceptional 5.0% |
| Luxembourgers | 99.2 /100 | #35 | Exceptional 5.0% |
Demographics Similar to Panamanians by Unemployment Among Women with Children Under 18 years
In terms of unemployment among women with children under 18 years, the demographic groups most similar to Panamanians are South American (5.7%, a difference of 0.010%), Nonimmigrants (5.7%, a difference of 0.11%), Immigrants from Western Asia (5.6%, a difference of 0.22%), American (5.7%, a difference of 0.23%), and Japanese (5.7%, a difference of 0.26%).
| Demographics | Rating | Rank | Unemployment Among Women with Children Under 18 years |
| Israelis | 15.6 /100 | #204 | Poor 5.6% |
| Tsimshian | 15.2 /100 | #205 | Poor 5.6% |
| Nicaraguans | 12.3 /100 | #206 | Poor 5.6% |
| Peruvians | 12.1 /100 | #207 | Poor 5.6% |
| Immigrants | Costa Rica | 11.6 /100 | #208 | Poor 5.6% |
| Immigrants | Western Asia | 11.3 /100 | #209 | Poor 5.6% |
| Immigrants | Nonimmigrants | 10.6 /100 | #210 | Poor 5.7% |
| Panamanians | 10.1 /100 | #211 | Poor 5.7% |
| South Americans | 10.0 /100 | #212 | Poor 5.7% |
| Americans | 8.9 /100 | #213 | Tragic 5.7% |
| Japanese | 8.7 /100 | #214 | Tragic 5.7% |
| Immigrants | Uganda | 7.9 /100 | #215 | Tragic 5.7% |
| Immigrants | Peru | 7.4 /100 | #216 | Tragic 5.7% |
| Immigrants | Brazil | 7.1 /100 | #217 | Tragic 5.7% |
| Immigrants | Nicaragua | 7.0 /100 | #218 | Tragic 5.7% |