Immigrants from Eastern Asia vs Fijian 3rd Grade
COMPARE
Immigrants from Eastern Asia
Fijian
3rd Grade
3rd Grade Comparison
Immigrants from Eastern Asia
Fijians
97.4%
3RD GRADE
1.9/ 100
METRIC RATING
234th/ 347
METRIC RANK
97.3%
3RD GRADE
0.2/ 100
METRIC RATING
269th/ 347
METRIC RANK
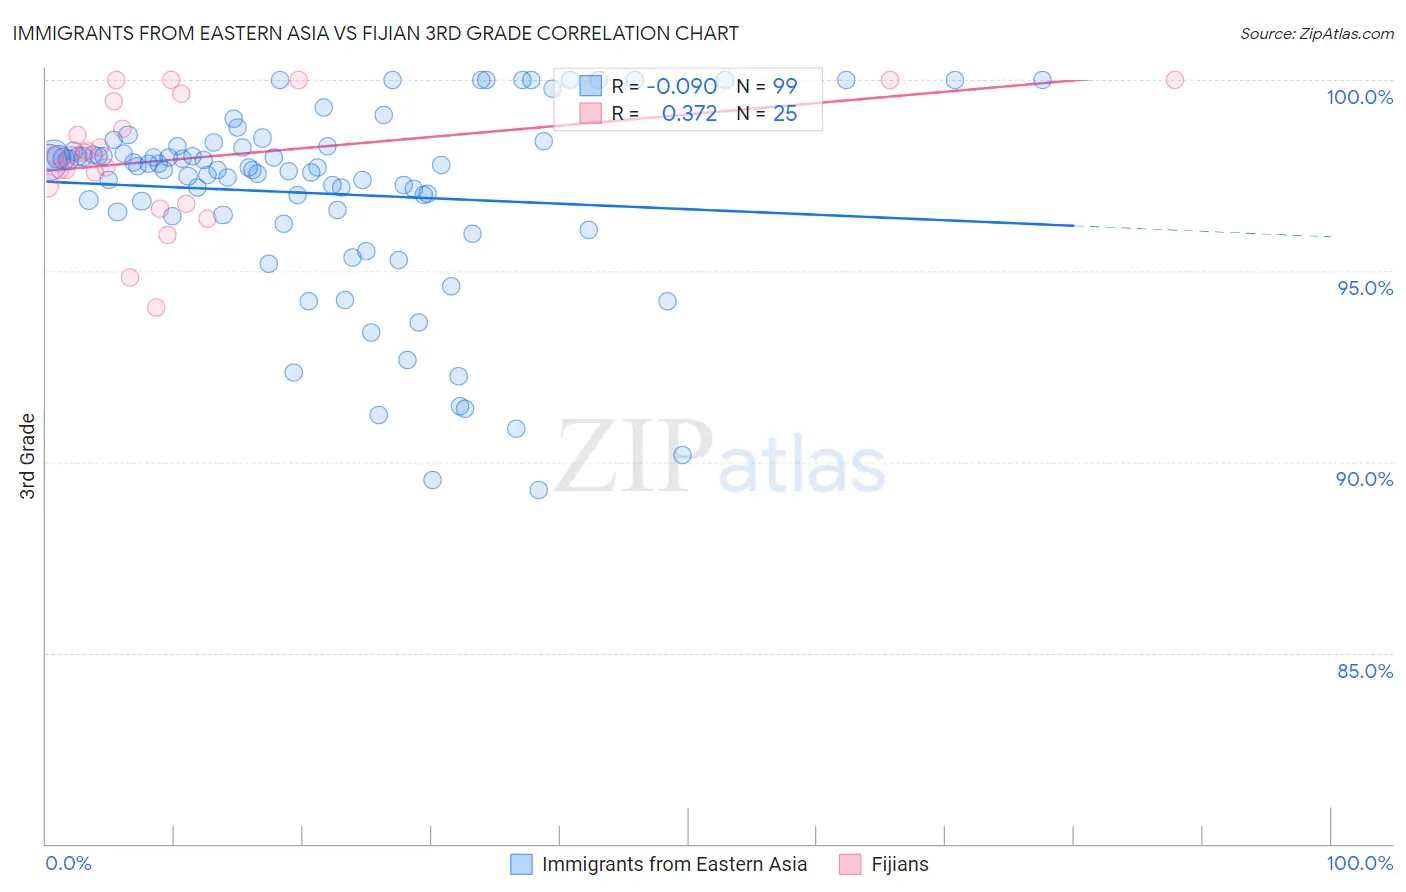
Immigrants from Eastern Asia vs Fijian 3rd Grade Correlation Chart
The statistical analysis conducted on geographies consisting of 499,865,893 people shows a slight negative correlation between the proportion of Immigrants from Eastern Asia and percentage of population with at least 3rd grade education in the United States with a correlation coefficient (R) of -0.090 and weighted average of 97.4%. Similarly, the statistical analysis conducted on geographies consisting of 55,948,842 people shows a mild positive correlation between the proportion of Fijians and percentage of population with at least 3rd grade education in the United States with a correlation coefficient (R) of 0.372 and weighted average of 97.3%, a difference of 0.18%.
3rd Grade Correlation Summary
| Measurement | Immigrants from Eastern Asia | Fijian |
| Minimum | 89.3% | 94.1% |
| Maximum | 100.0% | 100.0% |
| Range | 10.7% | 5.9% |
| Mean | 97.0% | 98.0% |
| Median | 97.7% | 98.0% |
| Interquartile 25% (IQ1) | 96.5% | 97.0% |
| Interquartile 75% (IQ3) | 98.3% | 99.5% |
| Interquartile Range (IQR) | 1.8% | 2.5% |
| Standard Deviation (Sample) | 2.5% | 1.6% |
| Standard Deviation (Population) | 2.5% | 1.6% |
Similar Demographics by 3rd Grade
Demographics Similar to Immigrants from Eastern Asia by 3rd Grade
In terms of 3rd grade, the demographic groups most similar to Immigrants from Eastern Asia are Immigrants from Iraq (97.4%, a difference of 0.010%), Liberian (97.4%, a difference of 0.010%), Colombian (97.4%, a difference of 0.010%), Immigrants from Uruguay (97.4%, a difference of 0.010%), and Immigrants from Western Asia (97.5%, a difference of 0.020%).
| Demographics | Rating | Rank | 3rd Grade |
| Immigrants | Sudan | 3.4 /100 | #227 | Tragic 97.5% |
| Sub-Saharan Africans | 3.2 /100 | #228 | Tragic 97.5% |
| Senegalese | 3.0 /100 | #229 | Tragic 97.5% |
| Immigrants | Pakistan | 2.7 /100 | #230 | Tragic 97.5% |
| Immigrants | Costa Rica | 2.7 /100 | #231 | Tragic 97.5% |
| Immigrants | Western Asia | 2.6 /100 | #232 | Tragic 97.5% |
| Immigrants | Malaysia | 2.4 /100 | #233 | Tragic 97.5% |
| Immigrants | Eastern Asia | 1.9 /100 | #234 | Tragic 97.4% |
| Immigrants | Iraq | 1.8 /100 | #235 | Tragic 97.4% |
| Liberians | 1.8 /100 | #236 | Tragic 97.4% |
| Colombians | 1.8 /100 | #237 | Tragic 97.4% |
| Immigrants | Uruguay | 1.7 /100 | #238 | Tragic 97.4% |
| Nigerians | 1.6 /100 | #239 | Tragic 97.4% |
| U.S. Virgin Islanders | 1.4 /100 | #240 | Tragic 97.4% |
| Immigrants | Indonesia | 1.4 /100 | #241 | Tragic 97.4% |
Demographics Similar to Fijians by 3rd Grade
In terms of 3rd grade, the demographic groups most similar to Fijians are Cuban (97.3%, a difference of 0.0%), Yaqui (97.3%, a difference of 0.010%), Immigrants from Nigeria (97.3%, a difference of 0.010%), Immigrants from Jamaica (97.3%, a difference of 0.020%), and Taiwanese (97.3%, a difference of 0.030%).
| Demographics | Rating | Rank | 3rd Grade |
| Immigrants | Sierra Leone | 0.4 /100 | #262 | Tragic 97.3% |
| Taiwanese | 0.3 /100 | #263 | Tragic 97.3% |
| West Indians | 0.3 /100 | #264 | Tragic 97.3% |
| Immigrants | Jamaica | 0.3 /100 | #265 | Tragic 97.3% |
| Yaqui | 0.3 /100 | #266 | Tragic 97.3% |
| Immigrants | Nigeria | 0.3 /100 | #267 | Tragic 97.3% |
| Cubans | 0.2 /100 | #268 | Tragic 97.3% |
| Fijians | 0.2 /100 | #269 | Tragic 97.3% |
| Immigrants | China | 0.2 /100 | #270 | Tragic 97.2% |
| Puerto Ricans | 0.2 /100 | #271 | Tragic 97.2% |
| Ghanaians | 0.1 /100 | #272 | Tragic 97.2% |
| Immigrants | Peru | 0.1 /100 | #273 | Tragic 97.2% |
| Immigrants | Cameroon | 0.1 /100 | #274 | Tragic 97.2% |
| Immigrants | Uzbekistan | 0.1 /100 | #275 | Tragic 97.2% |
| Immigrants | Bolivia | 0.1 /100 | #276 | Tragic 97.2% |