Immigrants from Eastern Asia vs Luxembourger 3rd Grade
COMPARE
Immigrants from Eastern Asia
Luxembourger
3rd Grade
3rd Grade Comparison
Immigrants from Eastern Asia
Luxembourgers
97.4%
3RD GRADE
1.9/ 100
METRIC RATING
234th/ 347
METRIC RANK
98.3%
3RD GRADE
99.9/ 100
METRIC RATING
41st/ 347
METRIC RANK
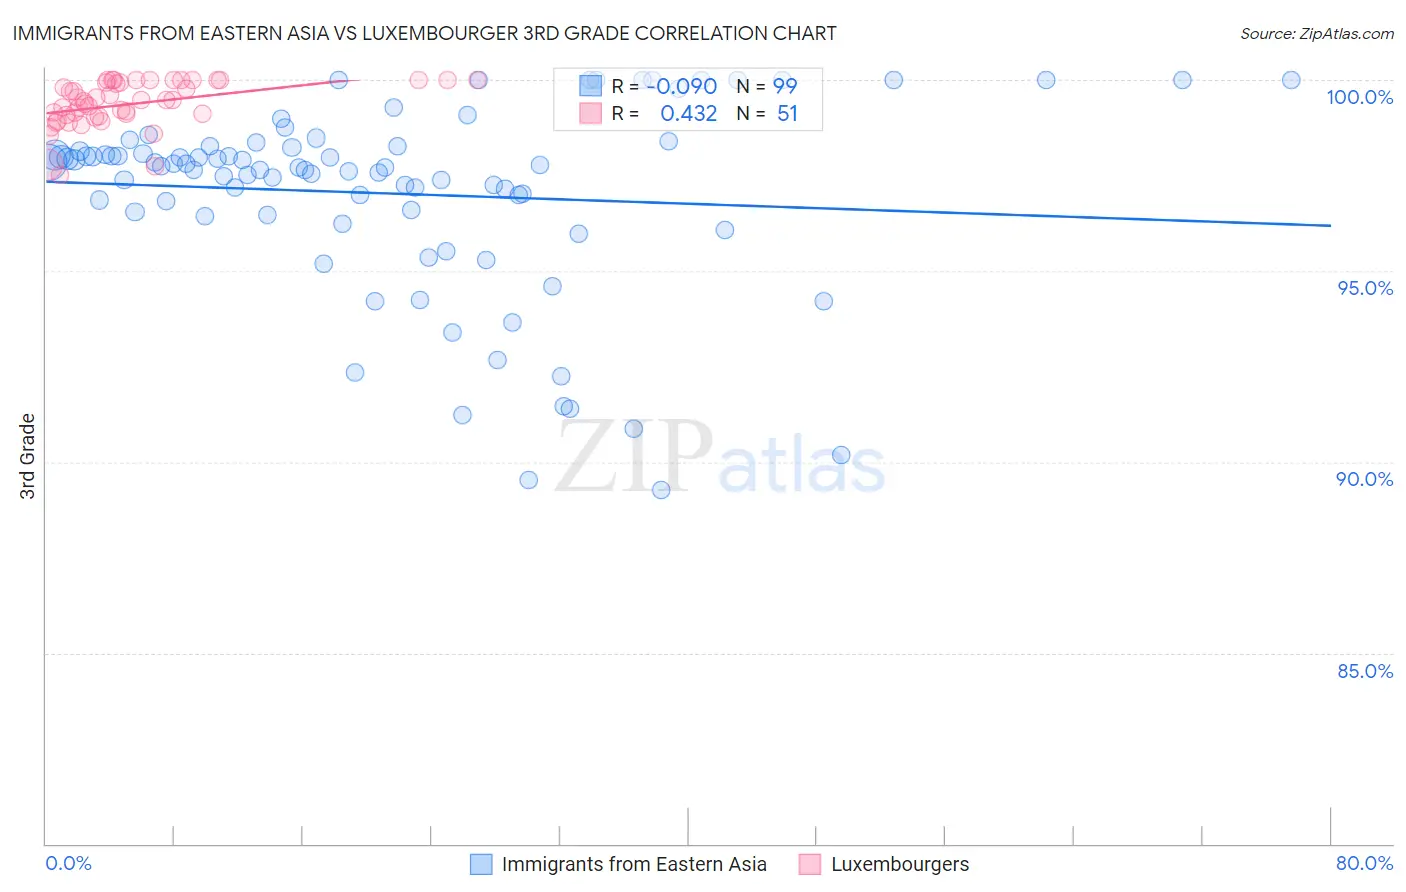
Immigrants from Eastern Asia vs Luxembourger 3rd Grade Correlation Chart
The statistical analysis conducted on geographies consisting of 499,865,893 people shows a slight negative correlation between the proportion of Immigrants from Eastern Asia and percentage of population with at least 3rd grade education in the United States with a correlation coefficient (R) of -0.090 and weighted average of 97.4%. Similarly, the statistical analysis conducted on geographies consisting of 144,675,804 people shows a moderate positive correlation between the proportion of Luxembourgers and percentage of population with at least 3rd grade education in the United States with a correlation coefficient (R) of 0.432 and weighted average of 98.3%, a difference of 0.93%.
3rd Grade Correlation Summary
| Measurement | Immigrants from Eastern Asia | Luxembourger |
| Minimum | 89.3% | 97.5% |
| Maximum | 100.0% | 100.0% |
| Range | 10.7% | 2.5% |
| Mean | 97.0% | 99.4% |
| Median | 97.7% | 99.5% |
| Interquartile 25% (IQ1) | 96.5% | 99.0% |
| Interquartile 75% (IQ3) | 98.3% | 100.0% |
| Interquartile Range (IQR) | 1.8% | 0.96% |
| Standard Deviation (Sample) | 2.5% | 0.61% |
| Standard Deviation (Population) | 2.5% | 0.61% |
Similar Demographics by 3rd Grade
Demographics Similar to Immigrants from Eastern Asia by 3rd Grade
In terms of 3rd grade, the demographic groups most similar to Immigrants from Eastern Asia are Immigrants from Iraq (97.4%, a difference of 0.010%), Liberian (97.4%, a difference of 0.010%), Colombian (97.4%, a difference of 0.010%), Immigrants from Uruguay (97.4%, a difference of 0.010%), and Immigrants from Western Asia (97.5%, a difference of 0.020%).
| Demographics | Rating | Rank | 3rd Grade |
| Immigrants | Sudan | 3.4 /100 | #227 | Tragic 97.5% |
| Sub-Saharan Africans | 3.2 /100 | #228 | Tragic 97.5% |
| Senegalese | 3.0 /100 | #229 | Tragic 97.5% |
| Immigrants | Pakistan | 2.7 /100 | #230 | Tragic 97.5% |
| Immigrants | Costa Rica | 2.7 /100 | #231 | Tragic 97.5% |
| Immigrants | Western Asia | 2.6 /100 | #232 | Tragic 97.5% |
| Immigrants | Malaysia | 2.4 /100 | #233 | Tragic 97.5% |
| Immigrants | Eastern Asia | 1.9 /100 | #234 | Tragic 97.4% |
| Immigrants | Iraq | 1.8 /100 | #235 | Tragic 97.4% |
| Liberians | 1.8 /100 | #236 | Tragic 97.4% |
| Colombians | 1.8 /100 | #237 | Tragic 97.4% |
| Immigrants | Uruguay | 1.7 /100 | #238 | Tragic 97.4% |
| Nigerians | 1.6 /100 | #239 | Tragic 97.4% |
| U.S. Virgin Islanders | 1.4 /100 | #240 | Tragic 97.4% |
| Immigrants | Indonesia | 1.4 /100 | #241 | Tragic 97.4% |
Demographics Similar to Luxembourgers by 3rd Grade
In terms of 3rd grade, the demographic groups most similar to Luxembourgers are Belgian (98.3%, a difference of 0.0%), Eastern European (98.3%, a difference of 0.010%), Northern European (98.3%, a difference of 0.010%), Latvian (98.4%, a difference of 0.020%), and Hungarian (98.3%, a difference of 0.020%).
| Demographics | Rating | Rank | 3rd Grade |
| Swiss | 100.0 /100 | #34 | Exceptional 98.4% |
| Arapaho | 100.0 /100 | #35 | Exceptional 98.4% |
| British | 99.9 /100 | #36 | Exceptional 98.4% |
| Italians | 99.9 /100 | #37 | Exceptional 98.4% |
| Chippewa | 99.9 /100 | #38 | Exceptional 98.4% |
| Latvians | 99.9 /100 | #39 | Exceptional 98.4% |
| Eastern Europeans | 99.9 /100 | #40 | Exceptional 98.3% |
| Luxembourgers | 99.9 /100 | #41 | Exceptional 98.3% |
| Belgians | 99.9 /100 | #42 | Exceptional 98.3% |
| Northern Europeans | 99.9 /100 | #43 | Exceptional 98.3% |
| Hungarians | 99.9 /100 | #44 | Exceptional 98.3% |
| Native Hawaiians | 99.9 /100 | #45 | Exceptional 98.3% |
| Ottawa | 99.8 /100 | #46 | Exceptional 98.3% |
| Czechoslovakians | 99.8 /100 | #47 | Exceptional 98.3% |
| Lumbee | 99.8 /100 | #48 | Exceptional 98.3% |