Immigrants from Eastern Africa vs West Indian Child Poverty Among Boys Under 16
COMPARE
Immigrants from Eastern Africa
West Indian
Child Poverty Among Boys Under 16
Child Poverty Among Boys Under 16 Comparison
Immigrants from Eastern Africa
West Indians
17.7%
CHILD POVERTY AMONG BOYS UNDER 16
6.0/ 100
METRIC RATING
213th/ 347
METRIC RANK
20.3%
CHILD POVERTY AMONG BOYS UNDER 16
0.0/ 100
METRIC RATING
286th/ 347
METRIC RANK
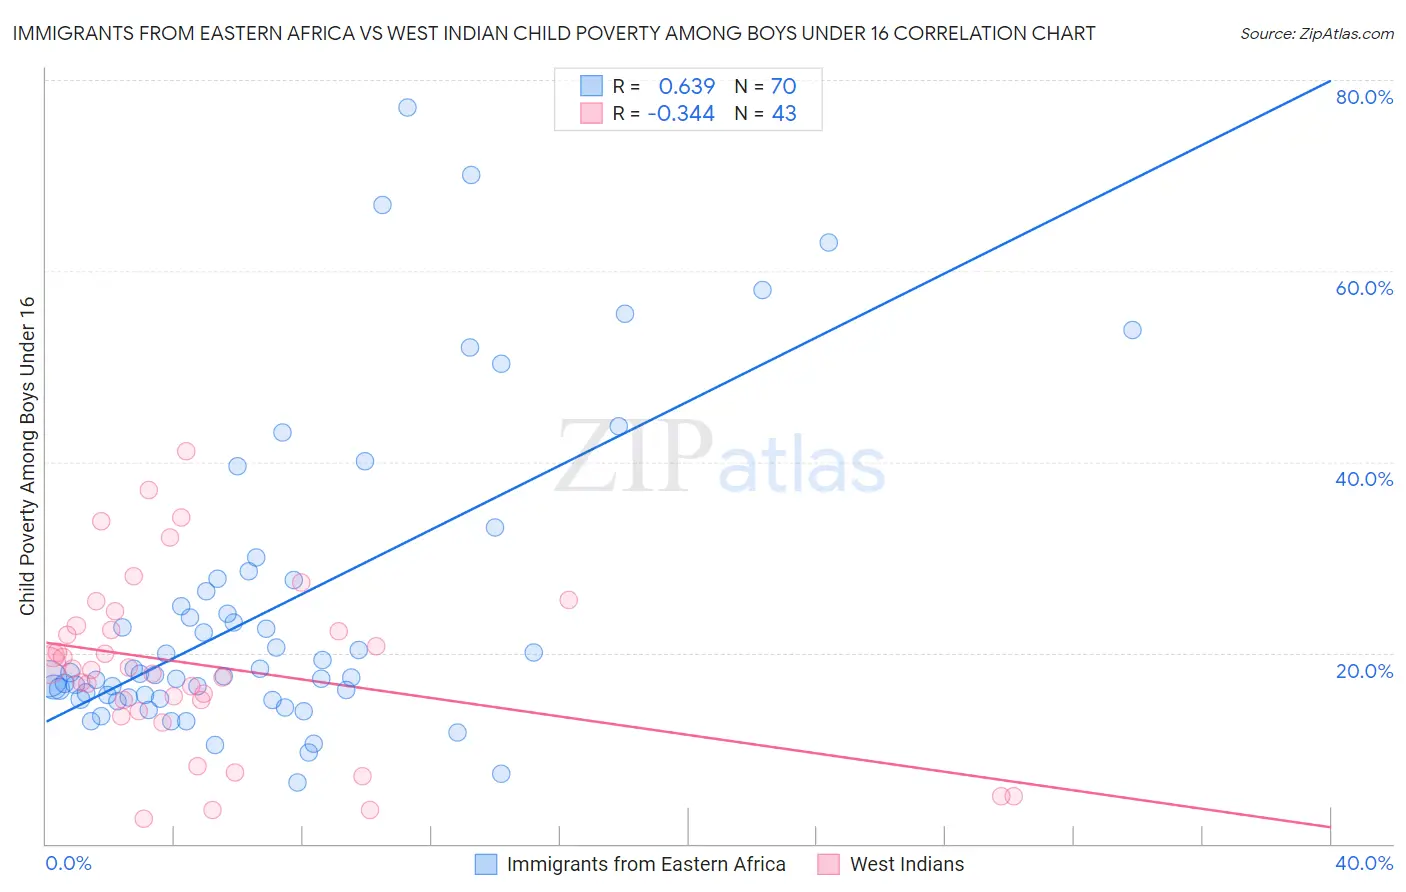
Immigrants from Eastern Africa vs West Indian Child Poverty Among Boys Under 16 Correlation Chart
The statistical analysis conducted on geographies consisting of 350,926,284 people shows a significant positive correlation between the proportion of Immigrants from Eastern Africa and poverty level among boys under the age of 16 in the United States with a correlation coefficient (R) of 0.639 and weighted average of 17.7%. Similarly, the statistical analysis conducted on geographies consisting of 251,779,775 people shows a mild negative correlation between the proportion of West Indians and poverty level among boys under the age of 16 in the United States with a correlation coefficient (R) of -0.344 and weighted average of 20.3%, a difference of 14.4%.
Child Poverty Among Boys Under 16 Correlation Summary
| Measurement | Immigrants from Eastern Africa | West Indian |
| Minimum | 6.5% | 2.6% |
| Maximum | 77.2% | 41.2% |
| Range | 70.7% | 38.6% |
| Mean | 24.7% | 18.6% |
| Median | 17.7% | 18.4% |
| Interquartile 25% (IQ1) | 15.3% | 13.9% |
| Interquartile 75% (IQ3) | 27.6% | 22.8% |
| Interquartile Range (IQR) | 12.3% | 8.9% |
| Standard Deviation (Sample) | 16.1% | 9.1% |
| Standard Deviation (Population) | 16.0% | 9.0% |
Similar Demographics by Child Poverty Among Boys Under 16
Demographics Similar to Immigrants from Eastern Africa by Child Poverty Among Boys Under 16
In terms of child poverty among boys under 16, the demographic groups most similar to Immigrants from Eastern Africa are Panamanian (17.7%, a difference of 0.0%), Osage (17.7%, a difference of 0.080%), Moroccan (17.7%, a difference of 0.17%), Japanese (17.7%, a difference of 0.20%), and Iraqi (17.7%, a difference of 0.22%).
| Demographics | Rating | Rank | Child Poverty Among Boys Under 16 |
| German Russians | 10.9 /100 | #206 | Poor 17.4% |
| Immigrants | Thailand | 8.2 /100 | #207 | Tragic 17.5% |
| Malaysians | 7.6 /100 | #208 | Tragic 17.6% |
| Alaskan Athabascans | 7.3 /100 | #209 | Tragic 17.6% |
| Immigrants | Armenia | 6.8 /100 | #210 | Tragic 17.6% |
| Immigrants | Immigrants | 6.7 /100 | #211 | Tragic 17.6% |
| Aleuts | 6.6 /100 | #212 | Tragic 17.7% |
| Immigrants | Eastern Africa | 6.0 /100 | #213 | Tragic 17.7% |
| Panamanians | 5.9 /100 | #214 | Tragic 17.7% |
| Osage | 5.8 /100 | #215 | Tragic 17.7% |
| Moroccans | 5.6 /100 | #216 | Tragic 17.7% |
| Japanese | 5.5 /100 | #217 | Tragic 17.7% |
| Iraqis | 5.5 /100 | #218 | Tragic 17.7% |
| Sierra Leoneans | 5.3 /100 | #219 | Tragic 17.8% |
| Immigrants | Cambodia | 5.1 /100 | #220 | Tragic 17.8% |
Demographics Similar to West Indians by Child Poverty Among Boys Under 16
In terms of child poverty among boys under 16, the demographic groups most similar to West Indians are Immigrants from Belize (20.3%, a difference of 0.060%), Immigrants from St. Vincent and the Grenadines (20.3%, a difference of 0.33%), Arapaho (20.2%, a difference of 0.34%), Barbadian (20.2%, a difference of 0.49%), and Blackfeet (20.4%, a difference of 0.57%).
| Demographics | Rating | Rank | Child Poverty Among Boys Under 16 |
| Bangladeshis | 0.0 /100 | #279 | Tragic 20.0% |
| Central Americans | 0.0 /100 | #280 | Tragic 20.1% |
| Immigrants | Zaire | 0.0 /100 | #281 | Tragic 20.1% |
| Comanche | 0.0 /100 | #282 | Tragic 20.1% |
| Immigrants | Jamaica | 0.0 /100 | #283 | Tragic 20.1% |
| Barbadians | 0.0 /100 | #284 | Tragic 20.2% |
| Arapaho | 0.0 /100 | #285 | Tragic 20.2% |
| West Indians | 0.0 /100 | #286 | Tragic 20.3% |
| Immigrants | Belize | 0.0 /100 | #287 | Tragic 20.3% |
| Immigrants | St. Vincent and the Grenadines | 0.0 /100 | #288 | Tragic 20.3% |
| Blackfeet | 0.0 /100 | #289 | Tragic 20.4% |
| Senegalese | 0.0 /100 | #290 | Tragic 20.6% |
| Immigrants | Latin America | 0.0 /100 | #291 | Tragic 20.6% |
| Yaqui | 0.0 /100 | #292 | Tragic 20.7% |
| Immigrants | Senegal | 0.0 /100 | #293 | Tragic 20.7% |