Immigrants from Eastern Africa vs Immigrants from Serbia Nursery School
COMPARE
Immigrants from Eastern Africa
Immigrants from Serbia
Nursery School
Nursery School Comparison
Immigrants from Eastern Africa
Immigrants from Serbia
97.6%
NURSERY SCHOOL
0.9/ 100
METRIC RATING
249th/ 347
METRIC RANK
98.2%
NURSERY SCHOOL
92.4/ 100
METRIC RATING
128th/ 347
METRIC RANK
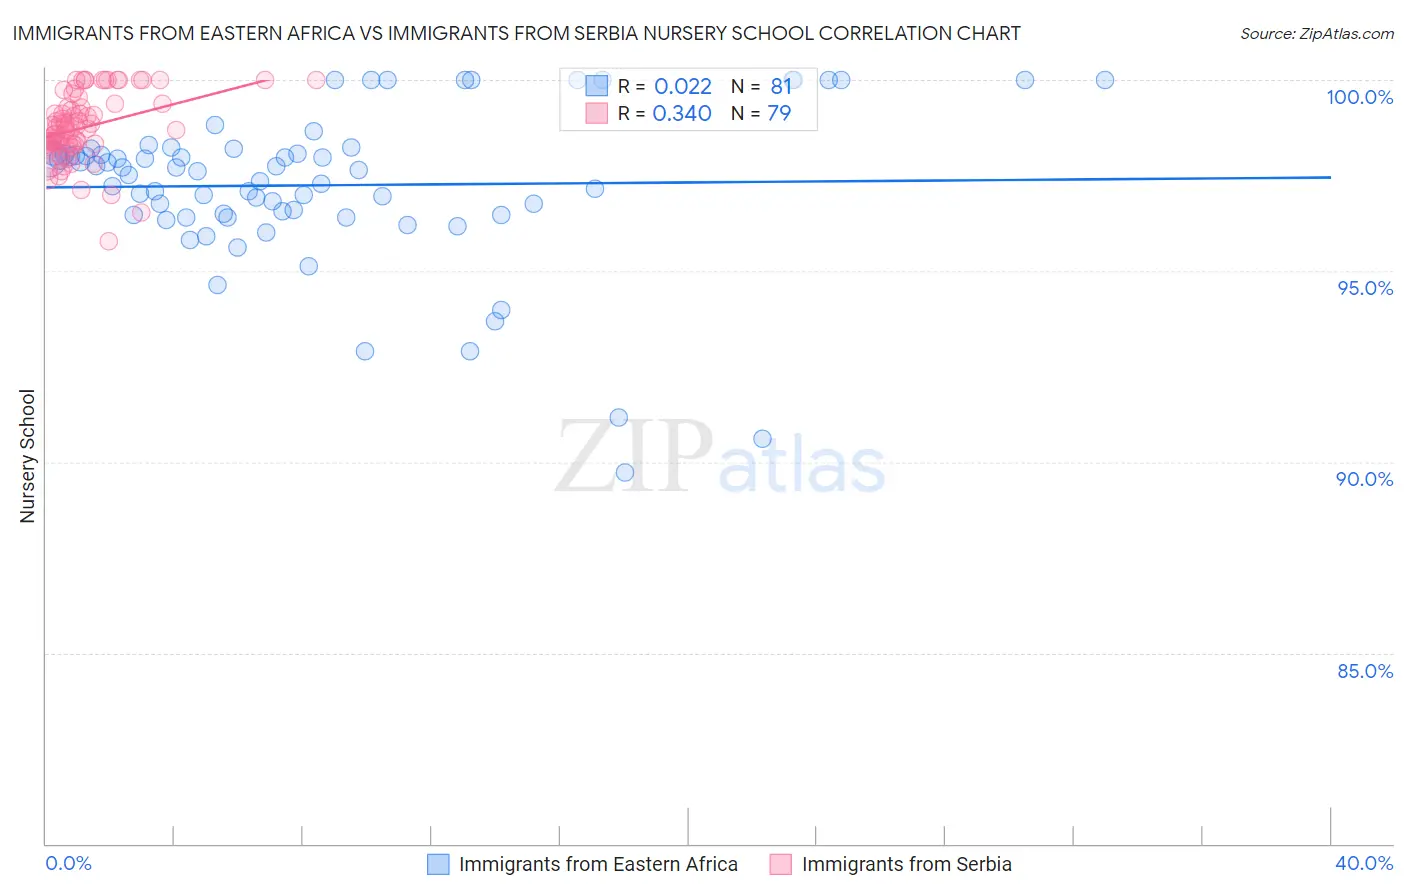
Immigrants from Eastern Africa vs Immigrants from Serbia Nursery School Correlation Chart
The statistical analysis conducted on geographies consisting of 355,144,184 people shows no correlation between the proportion of Immigrants from Eastern Africa and percentage of population with at least nursery school education in the United States with a correlation coefficient (R) of 0.022 and weighted average of 97.6%. Similarly, the statistical analysis conducted on geographies consisting of 131,729,423 people shows a mild positive correlation between the proportion of Immigrants from Serbia and percentage of population with at least nursery school education in the United States with a correlation coefficient (R) of 0.340 and weighted average of 98.2%, a difference of 0.54%.
Nursery School Correlation Summary
| Measurement | Immigrants from Eastern Africa | Immigrants from Serbia |
| Minimum | 89.7% | 95.8% |
| Maximum | 100.0% | 100.0% |
| Range | 10.3% | 4.2% |
| Mean | 97.2% | 98.8% |
| Median | 97.6% | 98.8% |
| Interquartile 25% (IQ1) | 96.5% | 98.3% |
| Interquartile 75% (IQ3) | 98.1% | 99.4% |
| Interquartile Range (IQR) | 1.7% | 1.1% |
| Standard Deviation (Sample) | 2.1% | 0.88% |
| Standard Deviation (Population) | 2.1% | 0.88% |
Similar Demographics by Nursery School
Demographics Similar to Immigrants from Eastern Africa by Nursery School
In terms of nursery school, the demographic groups most similar to Immigrants from Eastern Africa are Immigrants from Middle Africa (97.6%, a difference of 0.0%), Indian (Asian) (97.6%, a difference of 0.0%), Immigrants from Senegal (97.6%, a difference of 0.0%), Asian (97.6%, a difference of 0.010%), and South American (97.6%, a difference of 0.010%).
| Demographics | Rating | Rank | Nursery School |
| Liberians | 1.1 /100 | #242 | Tragic 97.7% |
| Asians | 1.1 /100 | #243 | Tragic 97.6% |
| South Americans | 1.0 /100 | #244 | Tragic 97.6% |
| Bolivians | 1.0 /100 | #245 | Tragic 97.6% |
| Peruvians | 1.0 /100 | #246 | Tragic 97.6% |
| Immigrants | Middle Africa | 0.9 /100 | #247 | Tragic 97.6% |
| Indians (Asian) | 0.9 /100 | #248 | Tragic 97.6% |
| Immigrants | Eastern Africa | 0.9 /100 | #249 | Tragic 97.6% |
| Immigrants | Senegal | 0.9 /100 | #250 | Tragic 97.6% |
| Ethiopians | 0.8 /100 | #251 | Tragic 97.6% |
| Immigrants | Africa | 0.8 /100 | #252 | Tragic 97.6% |
| Immigrants | Iraq | 0.7 /100 | #253 | Tragic 97.6% |
| Immigrants | Congo | 0.7 /100 | #254 | Tragic 97.6% |
| Immigrants | Asia | 0.7 /100 | #255 | Tragic 97.6% |
| Yaqui | 0.6 /100 | #256 | Tragic 97.6% |
Demographics Similar to Immigrants from Serbia by Nursery School
In terms of nursery school, the demographic groups most similar to Immigrants from Serbia are Iroquois (98.2%, a difference of 0.010%), Menominee (98.2%, a difference of 0.010%), Immigrants from Saudi Arabia (98.2%, a difference of 0.010%), Cambodian (98.2%, a difference of 0.010%), and Immigrants from Croatia (98.2%, a difference of 0.010%).
| Demographics | Rating | Rank | Nursery School |
| Immigrants | Zimbabwe | 94.2 /100 | #121 | Exceptional 98.2% |
| Immigrants | Japan | 94.0 /100 | #122 | Exceptional 98.2% |
| Syrians | 93.9 /100 | #123 | Exceptional 98.2% |
| Lebanese | 93.8 /100 | #124 | Exceptional 98.2% |
| Iroquois | 93.7 /100 | #125 | Exceptional 98.2% |
| Menominee | 93.6 /100 | #126 | Exceptional 98.2% |
| Immigrants | Saudi Arabia | 93.4 /100 | #127 | Exceptional 98.2% |
| Immigrants | Serbia | 92.4 /100 | #128 | Exceptional 98.2% |
| Cambodians | 91.4 /100 | #129 | Exceptional 98.2% |
| Immigrants | Croatia | 91.4 /100 | #130 | Exceptional 98.2% |
| Spaniards | 91.1 /100 | #131 | Exceptional 98.2% |
| Seminole | 90.9 /100 | #132 | Exceptional 98.2% |
| Immigrants | Europe | 90.7 /100 | #133 | Exceptional 98.1% |
| Immigrants | Bulgaria | 89.4 /100 | #134 | Excellent 98.1% |
| Immigrants | Hungary | 89.3 /100 | #135 | Excellent 98.1% |