Immigrants from Dominica vs U.S. Virgin Islander High School Diploma
COMPARE
Immigrants from Dominica
U.S. Virgin Islander
High School Diploma
High School Diploma Comparison
Immigrants from Dominica
U.S. Virgin Islanders
85.2%
HIGH SCHOOL DIPLOMA
0.0/ 100
METRIC RATING
309th/ 347
METRIC RANK
87.1%
HIGH SCHOOL DIPLOMA
0.2/ 100
METRIC RATING
265th/ 347
METRIC RANK
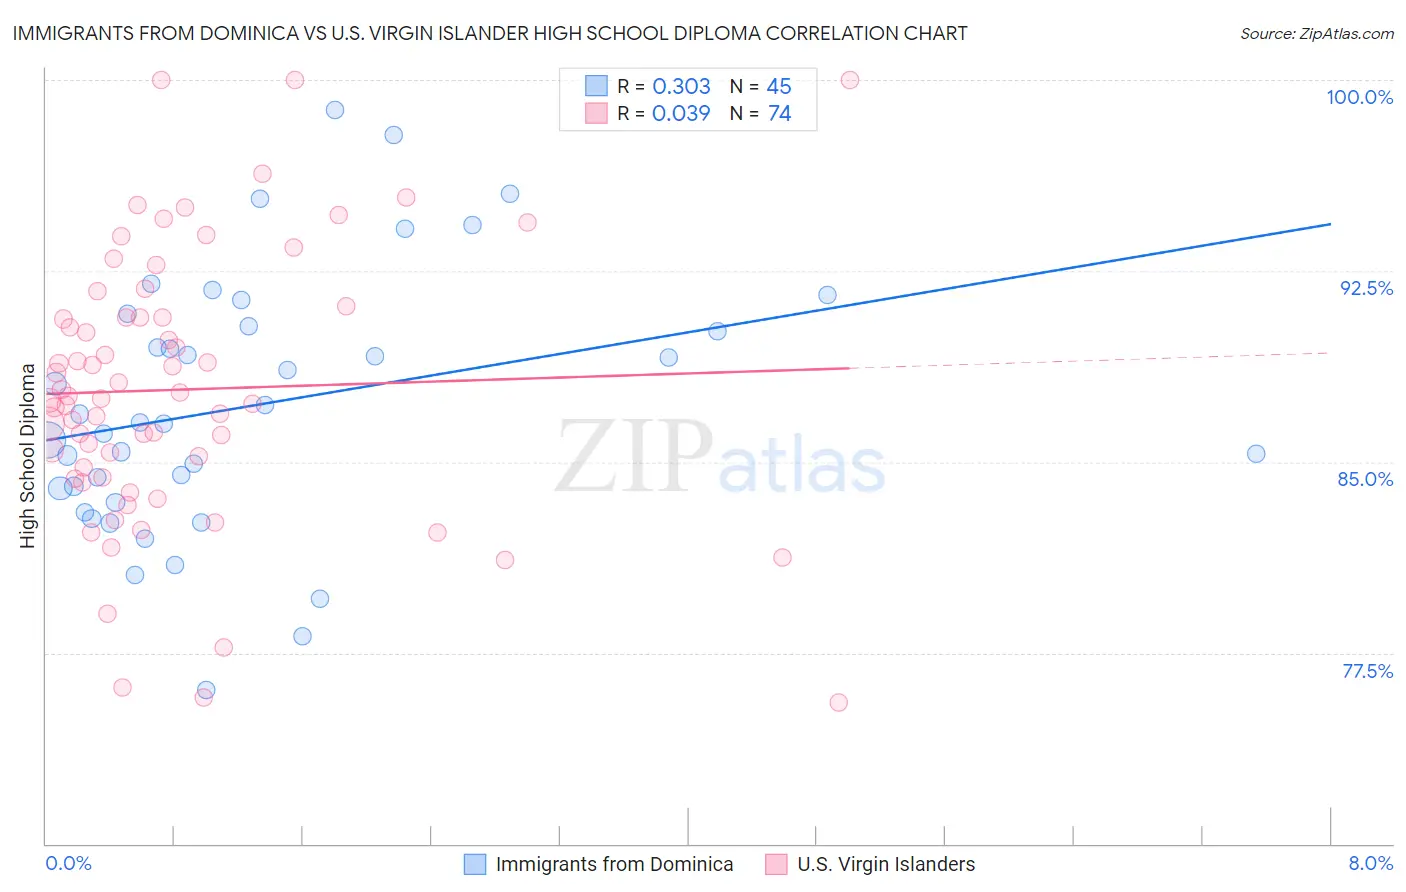
Immigrants from Dominica vs U.S. Virgin Islander High School Diploma Correlation Chart
The statistical analysis conducted on geographies consisting of 83,794,115 people shows a mild positive correlation between the proportion of Immigrants from Dominica and percentage of population with at least high school diploma education in the United States with a correlation coefficient (R) of 0.303 and weighted average of 85.2%. Similarly, the statistical analysis conducted on geographies consisting of 87,451,137 people shows no correlation between the proportion of U.S. Virgin Islanders and percentage of population with at least high school diploma education in the United States with a correlation coefficient (R) of 0.039 and weighted average of 87.1%, a difference of 2.2%.
High School Diploma Correlation Summary
| Measurement | Immigrants from Dominica | U.S. Virgin Islander |
| Minimum | 76.0% | 75.5% |
| Maximum | 98.8% | 100.0% |
| Range | 22.8% | 24.5% |
| Mean | 87.2% | 87.8% |
| Median | 86.5% | 87.5% |
| Interquartile 25% (IQ1) | 83.7% | 84.4% |
| Interquartile 75% (IQ3) | 90.6% | 90.7% |
| Interquartile Range (IQR) | 6.9% | 6.3% |
| Standard Deviation (Sample) | 5.1% | 5.4% |
| Standard Deviation (Population) | 5.0% | 5.3% |
Similar Demographics by High School Diploma
Demographics Similar to Immigrants from Dominica by High School Diploma
In terms of high school diploma, the demographic groups most similar to Immigrants from Dominica are Navajo (85.2%, a difference of 0.020%), Immigrants from Armenia (85.2%, a difference of 0.020%), Apache (85.1%, a difference of 0.080%), Ecuadorian (85.1%, a difference of 0.090%), and Immigrants from Guyana (85.3%, a difference of 0.11%).
| Demographics | Rating | Rank | High School Diploma |
| Immigrants | Haiti | 0.0 /100 | #302 | Tragic 85.4% |
| Cubans | 0.0 /100 | #303 | Tragic 85.4% |
| Nepalese | 0.0 /100 | #304 | Tragic 85.3% |
| Immigrants | Portugal | 0.0 /100 | #305 | Tragic 85.3% |
| Immigrants | Guyana | 0.0 /100 | #306 | Tragic 85.3% |
| Navajo | 0.0 /100 | #307 | Tragic 85.2% |
| Immigrants | Armenia | 0.0 /100 | #308 | Tragic 85.2% |
| Immigrants | Dominica | 0.0 /100 | #309 | Tragic 85.2% |
| Apache | 0.0 /100 | #310 | Tragic 85.1% |
| Ecuadorians | 0.0 /100 | #311 | Tragic 85.1% |
| Cape Verdeans | 0.0 /100 | #312 | Tragic 85.1% |
| Immigrants | Ecuador | 0.0 /100 | #313 | Tragic 84.8% |
| Yaqui | 0.0 /100 | #314 | Tragic 84.7% |
| Puerto Ricans | 0.0 /100 | #315 | Tragic 84.7% |
| Belizeans | 0.0 /100 | #316 | Tragic 84.3% |
Demographics Similar to U.S. Virgin Islanders by High School Diploma
In terms of high school diploma, the demographic groups most similar to U.S. Virgin Islanders are Immigrants from Congo (87.0%, a difference of 0.050%), Black/African American (87.0%, a difference of 0.060%), Pennsylvania German (87.0%, a difference of 0.10%), Sri Lankan (87.0%, a difference of 0.11%), and Malaysian (87.0%, a difference of 0.12%).
| Demographics | Rating | Rank | High School Diploma |
| Immigrants | Ghana | 0.5 /100 | #258 | Tragic 87.4% |
| Immigrants | Western Africa | 0.5 /100 | #259 | Tragic 87.4% |
| Cajuns | 0.4 /100 | #260 | Tragic 87.3% |
| Seminole | 0.4 /100 | #261 | Tragic 87.3% |
| Immigrants | Peru | 0.4 /100 | #262 | Tragic 87.3% |
| Immigrants | South Eastern Asia | 0.3 /100 | #263 | Tragic 87.2% |
| Jamaicans | 0.3 /100 | #264 | Tragic 87.2% |
| U.S. Virgin Islanders | 0.2 /100 | #265 | Tragic 87.1% |
| Immigrants | Congo | 0.2 /100 | #266 | Tragic 87.0% |
| Blacks/African Americans | 0.2 /100 | #267 | Tragic 87.0% |
| Pennsylvania Germans | 0.2 /100 | #268 | Tragic 87.0% |
| Sri Lankans | 0.2 /100 | #269 | Tragic 87.0% |
| Malaysians | 0.2 /100 | #270 | Tragic 87.0% |
| West Indians | 0.1 /100 | #271 | Tragic 86.9% |
| Trinidadians and Tobagonians | 0.1 /100 | #272 | Tragic 86.9% |