Immigrants from Dominica vs Immigrants from Cuba 8th Grade
COMPARE
Immigrants from Dominica
Immigrants from Cuba
8th Grade
8th Grade Comparison
Immigrants from Dominica
Immigrants from Cuba
94.0%
8TH GRADE
0.0/ 100
METRIC RATING
303rd/ 347
METRIC RANK
93.2%
8TH GRADE
0.0/ 100
METRIC RATING
319th/ 347
METRIC RANK
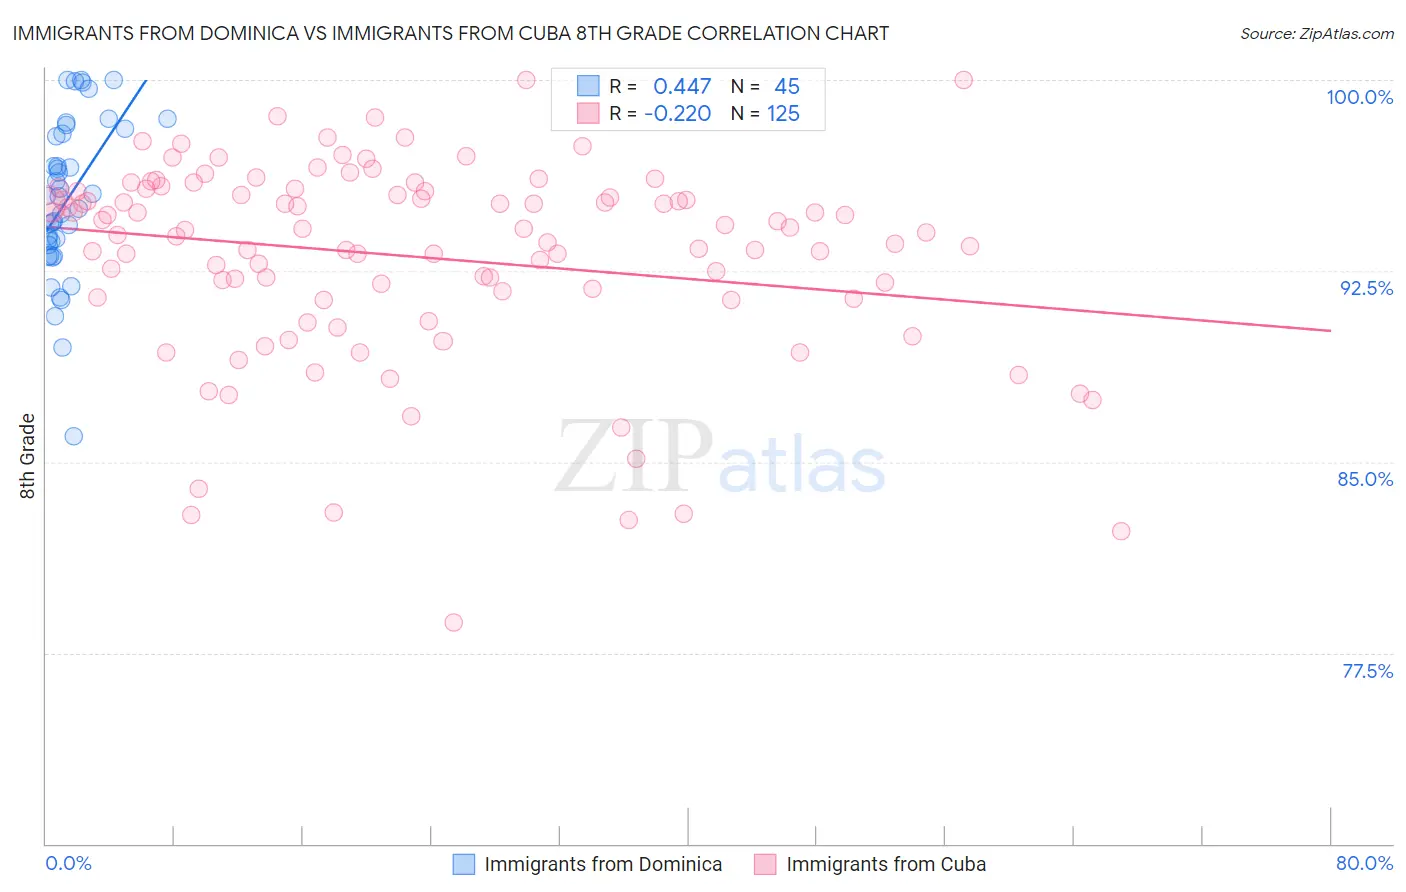
Immigrants from Dominica vs Immigrants from Cuba 8th Grade Correlation Chart
The statistical analysis conducted on geographies consisting of 83,794,115 people shows a moderate positive correlation between the proportion of Immigrants from Dominica and percentage of population with at least 8th grade education in the United States with a correlation coefficient (R) of 0.447 and weighted average of 94.0%. Similarly, the statistical analysis conducted on geographies consisting of 326,028,159 people shows a weak negative correlation between the proportion of Immigrants from Cuba and percentage of population with at least 8th grade education in the United States with a correlation coefficient (R) of -0.220 and weighted average of 93.2%, a difference of 0.80%.
8th Grade Correlation Summary
| Measurement | Immigrants from Dominica | Immigrants from Cuba |
| Minimum | 86.0% | 78.7% |
| Maximum | 100.0% | 100.0% |
| Range | 14.0% | 21.3% |
| Mean | 95.3% | 93.0% |
| Median | 95.4% | 94.1% |
| Interquartile 25% (IQ1) | 93.3% | 91.4% |
| Interquartile 75% (IQ3) | 98.0% | 95.6% |
| Interquartile Range (IQR) | 4.7% | 4.2% |
| Standard Deviation (Sample) | 3.1% | 3.9% |
| Standard Deviation (Population) | 3.1% | 3.9% |
Demographics Similar to Immigrants from Dominica and Immigrants from Cuba by 8th Grade
In terms of 8th grade, the demographic groups most similar to Immigrants from Dominica are Sri Lankan (94.0%, a difference of 0.040%), Guyanese (93.9%, a difference of 0.080%), Immigrants from Haiti (93.9%, a difference of 0.12%), Immigrants from Laos (94.1%, a difference of 0.14%), and Immigrants from Guyana (93.8%, a difference of 0.21%). Similarly, the demographic groups most similar to Immigrants from Cuba are Puerto Rican (93.2%, a difference of 0.030%), Immigrants from Fiji (93.2%, a difference of 0.030%), Immigrants from Ecuador (93.3%, a difference of 0.040%), Immigrants from Cambodia (93.3%, a difference of 0.10%), and Belizean (93.1%, a difference of 0.16%).
| Demographics | Rating | Rank | 8th Grade |
| Immigrants | Laos | 0.0 /100 | #301 | Tragic 94.1% |
| Sri Lankans | 0.0 /100 | #302 | Tragic 94.0% |
| Immigrants | Dominica | 0.0 /100 | #303 | Tragic 94.0% |
| Guyanese | 0.0 /100 | #304 | Tragic 93.9% |
| Immigrants | Haiti | 0.0 /100 | #305 | Tragic 93.9% |
| Immigrants | Guyana | 0.0 /100 | #306 | Tragic 93.8% |
| Immigrants | Portugal | 0.0 /100 | #307 | Tragic 93.8% |
| Ecuadorians | 0.0 /100 | #308 | Tragic 93.6% |
| Immigrants | Immigrants | 0.0 /100 | #309 | Tragic 93.6% |
| Japanese | 0.0 /100 | #310 | Tragic 93.6% |
| Immigrants | Bangladesh | 0.0 /100 | #311 | Tragic 93.6% |
| Cape Verdeans | 0.0 /100 | #312 | Tragic 93.5% |
| Immigrants | Caribbean | 0.0 /100 | #313 | Tragic 93.5% |
| Immigrants | Vietnam | 0.0 /100 | #314 | Tragic 93.5% |
| Vietnamese | 0.0 /100 | #315 | Tragic 93.5% |
| Immigrants | Cambodia | 0.0 /100 | #316 | Tragic 93.3% |
| Immigrants | Ecuador | 0.0 /100 | #317 | Tragic 93.3% |
| Puerto Ricans | 0.0 /100 | #318 | Tragic 93.2% |
| Immigrants | Cuba | 0.0 /100 | #319 | Tragic 93.2% |
| Immigrants | Fiji | 0.0 /100 | #320 | Tragic 93.2% |
| Belizeans | 0.0 /100 | #321 | Tragic 93.1% |