Immigrants from Dominica vs Venezuelan 8th Grade
COMPARE
Immigrants from Dominica
Venezuelan
8th Grade
8th Grade Comparison
Immigrants from Dominica
Venezuelans
94.0%
8TH GRADE
0.0/ 100
METRIC RATING
303rd/ 347
METRIC RANK
95.7%
8TH GRADE
47.5/ 100
METRIC RATING
178th/ 347
METRIC RANK
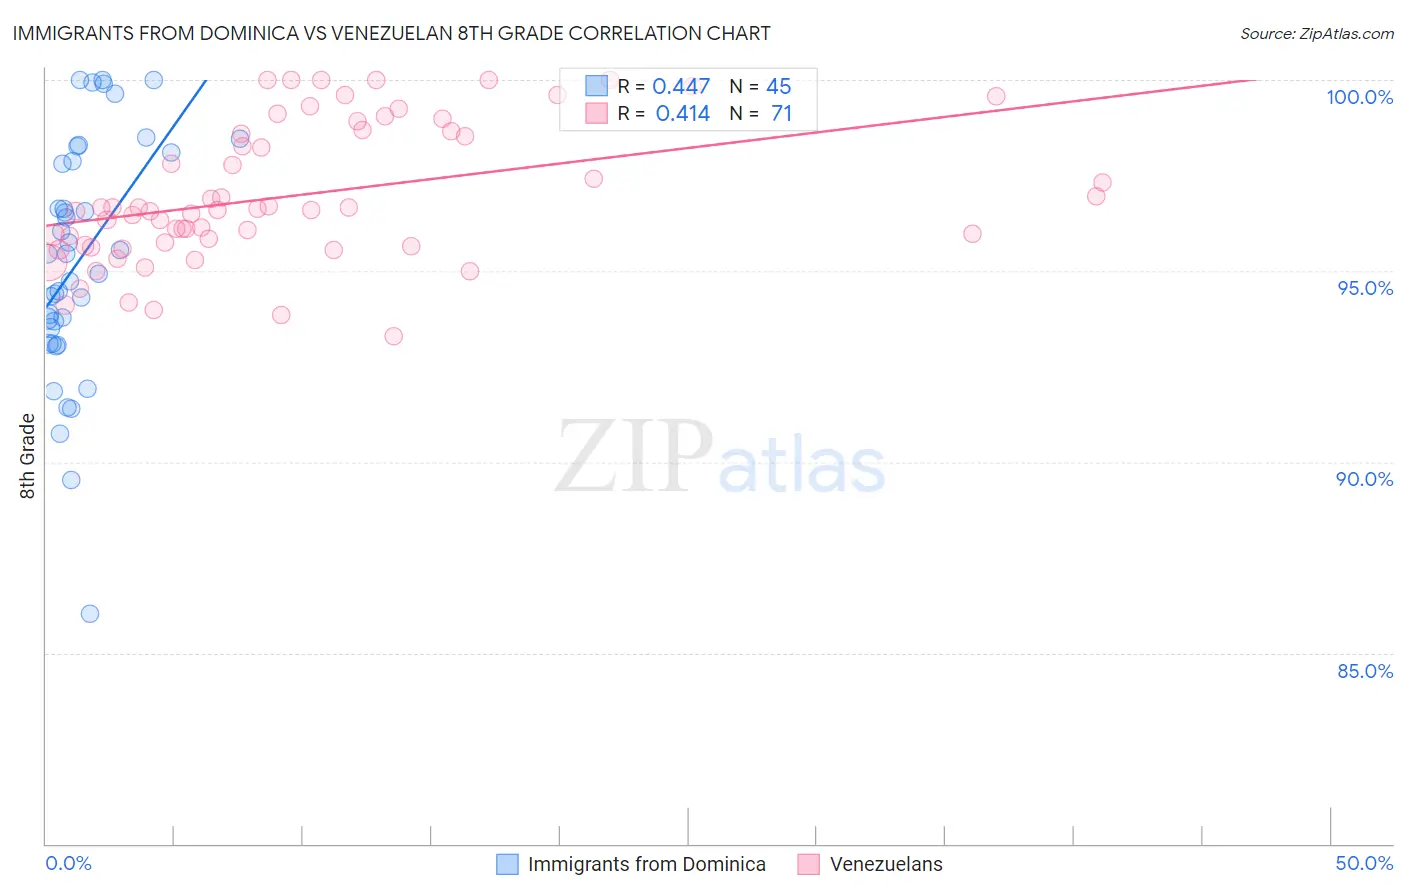
Immigrants from Dominica vs Venezuelan 8th Grade Correlation Chart
The statistical analysis conducted on geographies consisting of 83,794,115 people shows a moderate positive correlation between the proportion of Immigrants from Dominica and percentage of population with at least 8th grade education in the United States with a correlation coefficient (R) of 0.447 and weighted average of 94.0%. Similarly, the statistical analysis conducted on geographies consisting of 306,323,638 people shows a moderate positive correlation between the proportion of Venezuelans and percentage of population with at least 8th grade education in the United States with a correlation coefficient (R) of 0.414 and weighted average of 95.7%, a difference of 1.9%.
8th Grade Correlation Summary
| Measurement | Immigrants from Dominica | Venezuelan |
| Minimum | 86.0% | 93.3% |
| Maximum | 100.0% | 100.0% |
| Range | 14.0% | 6.7% |
| Mean | 95.3% | 97.0% |
| Median | 95.4% | 96.6% |
| Interquartile 25% (IQ1) | 93.3% | 95.7% |
| Interquartile 75% (IQ3) | 98.0% | 98.7% |
| Interquartile Range (IQR) | 4.7% | 3.0% |
| Standard Deviation (Sample) | 3.1% | 1.8% |
| Standard Deviation (Population) | 3.1% | 1.8% |
Similar Demographics by 8th Grade
Demographics Similar to Immigrants from Dominica by 8th Grade
In terms of 8th grade, the demographic groups most similar to Immigrants from Dominica are Sri Lankan (94.0%, a difference of 0.040%), Guyanese (93.9%, a difference of 0.080%), Immigrants from Haiti (93.9%, a difference of 0.12%), Immigrants from Laos (94.1%, a difference of 0.14%), and Immigrants from Burma/Myanmar (94.1%, a difference of 0.16%).
| Demographics | Rating | Rank | 8th Grade |
| Haitians | 0.0 /100 | #296 | Tragic 94.2% |
| Immigrants | South Eastern Asia | 0.0 /100 | #297 | Tragic 94.2% |
| Indonesians | 0.0 /100 | #298 | Tragic 94.1% |
| Cubans | 0.0 /100 | #299 | Tragic 94.1% |
| Immigrants | Burma/Myanmar | 0.0 /100 | #300 | Tragic 94.1% |
| Immigrants | Laos | 0.0 /100 | #301 | Tragic 94.1% |
| Sri Lankans | 0.0 /100 | #302 | Tragic 94.0% |
| Immigrants | Dominica | 0.0 /100 | #303 | Tragic 94.0% |
| Guyanese | 0.0 /100 | #304 | Tragic 93.9% |
| Immigrants | Haiti | 0.0 /100 | #305 | Tragic 93.9% |
| Immigrants | Guyana | 0.0 /100 | #306 | Tragic 93.8% |
| Immigrants | Portugal | 0.0 /100 | #307 | Tragic 93.8% |
| Ecuadorians | 0.0 /100 | #308 | Tragic 93.6% |
| Immigrants | Immigrants | 0.0 /100 | #309 | Tragic 93.6% |
| Japanese | 0.0 /100 | #310 | Tragic 93.6% |
Demographics Similar to Venezuelans by 8th Grade
In terms of 8th grade, the demographic groups most similar to Venezuelans are Marshallese (95.7%, a difference of 0.0%), Immigrants from Albania (95.7%, a difference of 0.010%), Pakistani (95.7%, a difference of 0.010%), Immigrants from Brazil (95.7%, a difference of 0.010%), and Chilean (95.7%, a difference of 0.020%).
| Demographics | Rating | Rank | 8th Grade |
| Egyptians | 58.2 /100 | #171 | Average 95.8% |
| Immigrants | Korea | 57.9 /100 | #172 | Average 95.8% |
| Mongolians | 53.0 /100 | #173 | Average 95.8% |
| Chileans | 50.0 /100 | #174 | Average 95.7% |
| Immigrants | Albania | 49.6 /100 | #175 | Average 95.7% |
| Pakistanis | 48.8 /100 | #176 | Average 95.7% |
| Marshallese | 47.6 /100 | #177 | Average 95.7% |
| Venezuelans | 47.5 /100 | #178 | Average 95.7% |
| Immigrants | Brazil | 45.4 /100 | #179 | Average 95.7% |
| Iraqis | 40.5 /100 | #180 | Average 95.7% |
| Immigrants | Spain | 38.7 /100 | #181 | Fair 95.7% |
| Immigrants | Egypt | 37.9 /100 | #182 | Fair 95.7% |
| Immigrants | Iraq | 36.2 /100 | #183 | Fair 95.6% |
| Immigrants | Uganda | 36.0 /100 | #184 | Fair 95.6% |
| Blacks/African Americans | 34.8 /100 | #185 | Fair 95.6% |