Hopi vs Immigrants from Cuba 8th Grade
COMPARE
Hopi
Immigrants from Cuba
8th Grade
8th Grade Comparison
Hopi
Immigrants from Cuba
95.9%
8TH GRADE
79.4/ 100
METRIC RATING
154th/ 347
METRIC RANK
93.2%
8TH GRADE
0.0/ 100
METRIC RATING
319th/ 347
METRIC RANK
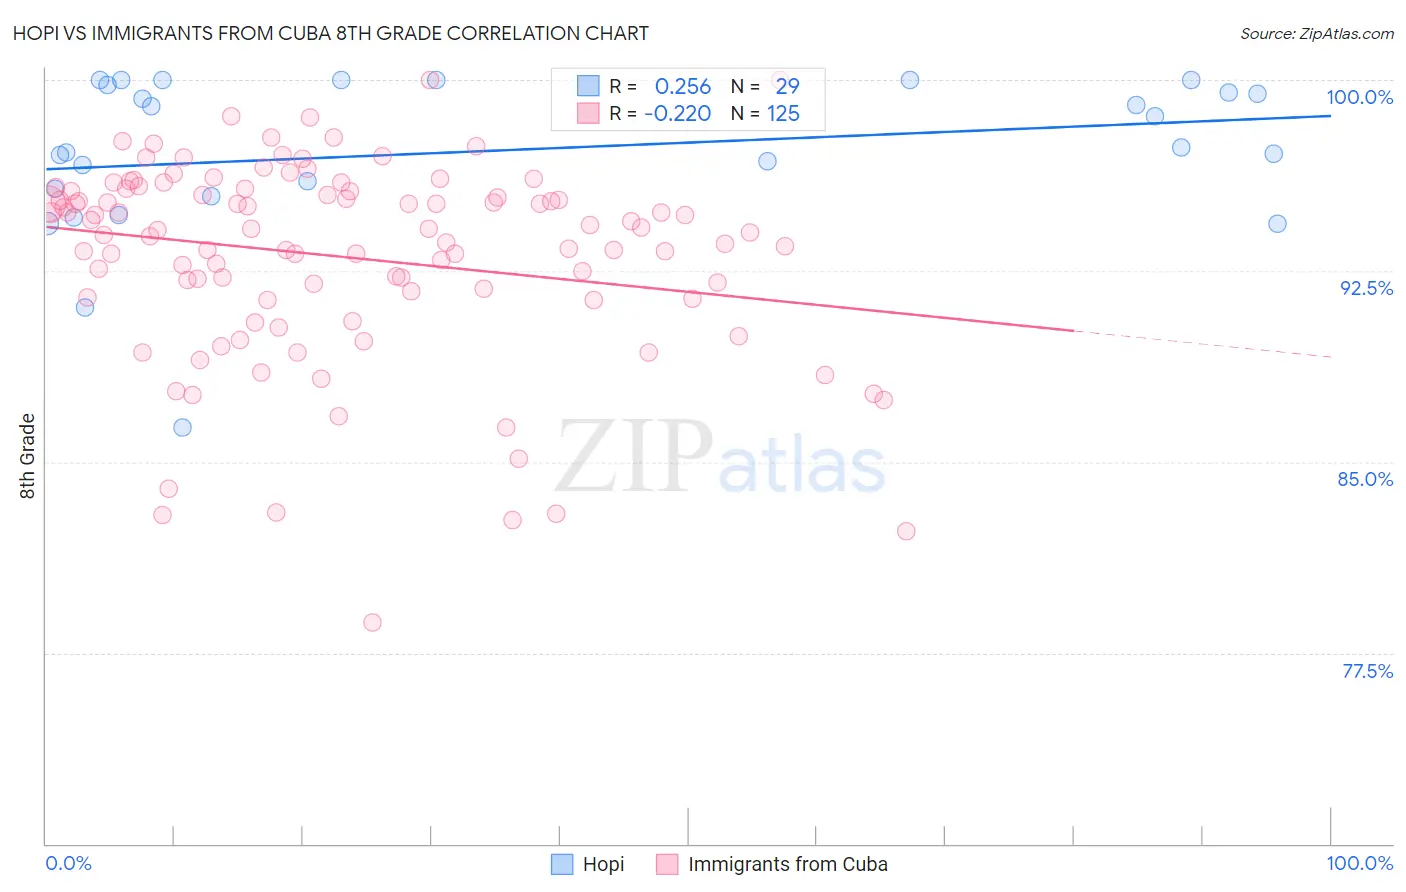
Hopi vs Immigrants from Cuba 8th Grade Correlation Chart
The statistical analysis conducted on geographies consisting of 74,739,957 people shows a weak positive correlation between the proportion of Hopi and percentage of population with at least 8th grade education in the United States with a correlation coefficient (R) of 0.256 and weighted average of 95.9%. Similarly, the statistical analysis conducted on geographies consisting of 326,028,159 people shows a weak negative correlation between the proportion of Immigrants from Cuba and percentage of population with at least 8th grade education in the United States with a correlation coefficient (R) of -0.220 and weighted average of 93.2%, a difference of 2.9%.
8th Grade Correlation Summary
| Measurement | Hopi | Immigrants from Cuba |
| Minimum | 86.4% | 78.7% |
| Maximum | 100.0% | 100.0% |
| Range | 13.6% | 21.3% |
| Mean | 97.2% | 93.0% |
| Median | 97.4% | 94.1% |
| Interquartile 25% (IQ1) | 95.6% | 91.4% |
| Interquartile 75% (IQ3) | 99.9% | 95.6% |
| Interquartile Range (IQR) | 4.3% | 4.2% |
| Standard Deviation (Sample) | 3.1% | 3.9% |
| Standard Deviation (Population) | 3.1% | 3.9% |
Similar Demographics by 8th Grade
Demographics Similar to Hopi by 8th Grade
In terms of 8th grade, the demographic groups most similar to Hopi are Immigrants from Jordan (95.9%, a difference of 0.0%), Blackfeet (96.0%, a difference of 0.010%), French American Indian (96.0%, a difference of 0.010%), Immigrants from Israel (96.0%, a difference of 0.020%), and Immigrants from Russia (96.0%, a difference of 0.020%).
| Demographics | Rating | Rank | 8th Grade |
| Colville | 84.0 /100 | #147 | Excellent 96.0% |
| Albanians | 83.1 /100 | #148 | Excellent 96.0% |
| Immigrants | Israel | 81.3 /100 | #149 | Excellent 96.0% |
| Immigrants | Russia | 80.9 /100 | #150 | Excellent 96.0% |
| Blackfeet | 80.8 /100 | #151 | Excellent 96.0% |
| French American Indians | 80.6 /100 | #152 | Excellent 96.0% |
| Immigrants | Jordan | 79.5 /100 | #153 | Good 95.9% |
| Hopi | 79.4 /100 | #154 | Good 95.9% |
| Kenyans | 74.5 /100 | #155 | Good 95.9% |
| Ugandans | 74.1 /100 | #156 | Good 95.9% |
| Immigrants | Taiwan | 70.5 /100 | #157 | Good 95.9% |
| Arabs | 69.4 /100 | #158 | Good 95.9% |
| Immigrants | Kazakhstan | 68.4 /100 | #159 | Good 95.9% |
| Seminole | 67.7 /100 | #160 | Good 95.8% |
| Bermudans | 67.5 /100 | #161 | Good 95.8% |
Demographics Similar to Immigrants from Cuba by 8th Grade
In terms of 8th grade, the demographic groups most similar to Immigrants from Cuba are Puerto Rican (93.2%, a difference of 0.030%), Immigrants from Fiji (93.2%, a difference of 0.030%), Immigrants from Ecuador (93.3%, a difference of 0.040%), Immigrants from Cambodia (93.3%, a difference of 0.10%), and Belizean (93.1%, a difference of 0.16%).
| Demographics | Rating | Rank | 8th Grade |
| Cape Verdeans | 0.0 /100 | #312 | Tragic 93.5% |
| Immigrants | Caribbean | 0.0 /100 | #313 | Tragic 93.5% |
| Immigrants | Vietnam | 0.0 /100 | #314 | Tragic 93.5% |
| Vietnamese | 0.0 /100 | #315 | Tragic 93.5% |
| Immigrants | Cambodia | 0.0 /100 | #316 | Tragic 93.3% |
| Immigrants | Ecuador | 0.0 /100 | #317 | Tragic 93.3% |
| Puerto Ricans | 0.0 /100 | #318 | Tragic 93.2% |
| Immigrants | Cuba | 0.0 /100 | #319 | Tragic 93.2% |
| Immigrants | Fiji | 0.0 /100 | #320 | Tragic 93.2% |
| Belizeans | 0.0 /100 | #321 | Tragic 93.1% |
| Nicaraguans | 0.0 /100 | #322 | Tragic 93.0% |
| Immigrants | Belize | 0.0 /100 | #323 | Tragic 92.9% |
| Nepalese | 0.0 /100 | #324 | Tragic 92.8% |
| Dominicans | 0.0 /100 | #325 | Tragic 92.8% |
| Central American Indians | 0.0 /100 | #326 | Tragic 92.7% |