Hispanic or Latino vs Jordanian Nursery School
COMPARE
Hispanic or Latino
Jordanian
Nursery School
Nursery School Comparison
Hispanics or Latinos
Jordanians
97.0%
NURSERY SCHOOL
0.0/ 100
METRIC RATING
307th/ 347
METRIC RANK
98.1%
NURSERY SCHOOL
72.9/ 100
METRIC RATING
150th/ 347
METRIC RANK
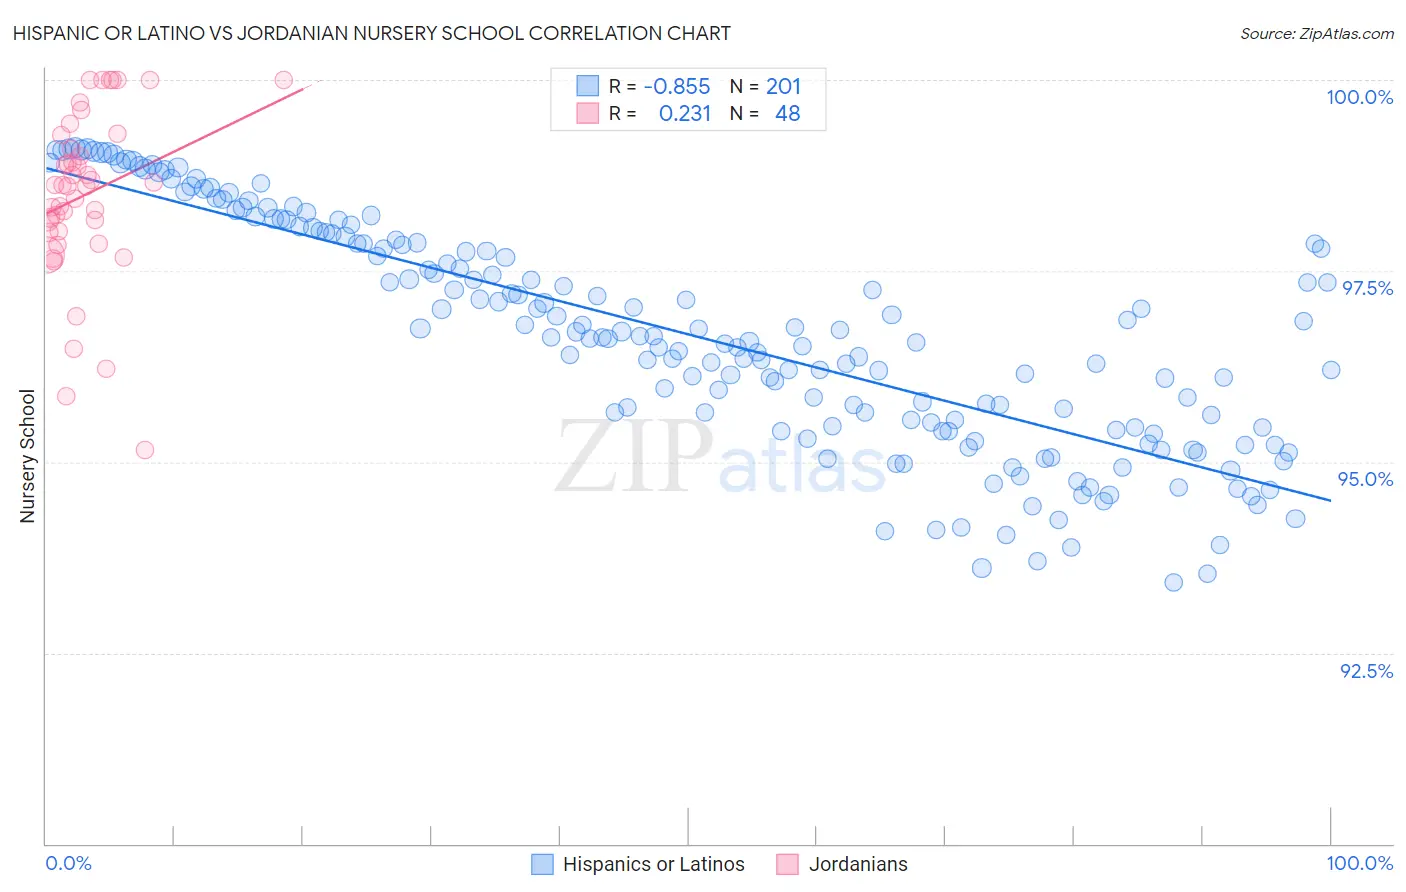
Hispanic or Latino vs Jordanian Nursery School Correlation Chart
The statistical analysis conducted on geographies consisting of 578,615,396 people shows a very strong negative correlation between the proportion of Hispanics or Latinos and percentage of population with at least nursery school education in the United States with a correlation coefficient (R) of -0.855 and weighted average of 97.0%. Similarly, the statistical analysis conducted on geographies consisting of 166,423,717 people shows a weak positive correlation between the proportion of Jordanians and percentage of population with at least nursery school education in the United States with a correlation coefficient (R) of 0.231 and weighted average of 98.1%, a difference of 1.1%.
Nursery School Correlation Summary
| Measurement | Hispanic or Latino | Jordanian |
| Minimum | 93.4% | 95.2% |
| Maximum | 99.1% | 100.0% |
| Range | 5.7% | 4.8% |
| Mean | 96.7% | 98.5% |
| Median | 96.6% | 98.6% |
| Interquartile 25% (IQ1) | 95.4% | 98.0% |
| Interquartile 75% (IQ3) | 97.9% | 99.2% |
| Interquartile Range (IQR) | 2.4% | 1.2% |
| Standard Deviation (Sample) | 1.5% | 1.1% |
| Standard Deviation (Population) | 1.5% | 1.1% |
Similar Demographics by Nursery School
Demographics Similar to Hispanics or Latinos by Nursery School
In terms of nursery school, the demographic groups most similar to Hispanics or Latinos are Immigrants from Haiti (97.0%, a difference of 0.0%), Belizean (97.0%, a difference of 0.010%), Immigrants from Somalia (97.0%, a difference of 0.010%), Guyanese (97.0%, a difference of 0.030%), and Immigrants from the Azores (97.0%, a difference of 0.030%).
| Demographics | Rating | Rank | Nursery School |
| Haitians | 0.0 /100 | #300 | Tragic 97.2% |
| Immigrants | South Eastern Asia | 0.0 /100 | #301 | Tragic 97.1% |
| Immigrants | Caribbean | 0.0 /100 | #302 | Tragic 97.1% |
| Nicaraguans | 0.0 /100 | #303 | Tragic 97.1% |
| Ecuadorians | 0.0 /100 | #304 | Tragic 97.1% |
| Somalis | 0.0 /100 | #305 | Tragic 97.1% |
| Belizeans | 0.0 /100 | #306 | Tragic 97.0% |
| Hispanics or Latinos | 0.0 /100 | #307 | Tragic 97.0% |
| Immigrants | Haiti | 0.0 /100 | #308 | Tragic 97.0% |
| Immigrants | Somalia | 0.0 /100 | #309 | Tragic 97.0% |
| Guyanese | 0.0 /100 | #310 | Tragic 97.0% |
| Immigrants | Azores | 0.0 /100 | #311 | Tragic 97.0% |
| Sri Lankans | 0.0 /100 | #312 | Tragic 97.0% |
| Hondurans | 0.0 /100 | #313 | Tragic 97.0% |
| Cape Verdeans | 0.0 /100 | #314 | Tragic 97.0% |
Demographics Similar to Jordanians by Nursery School
In terms of nursery school, the demographic groups most similar to Jordanians are Apache (98.1%, a difference of 0.0%), Soviet Union (98.0%, a difference of 0.0%), Hmong (98.1%, a difference of 0.010%), Immigrants from Greece (98.1%, a difference of 0.010%), and Dutch West Indian (98.0%, a difference of 0.010%).
| Demographics | Rating | Rank | Nursery School |
| Marshallese | 81.2 /100 | #143 | Excellent 98.1% |
| Alsatians | 80.3 /100 | #144 | Excellent 98.1% |
| Immigrants | Israel | 78.5 /100 | #145 | Good 98.1% |
| Filipinos | 78.5 /100 | #146 | Good 98.1% |
| Hmong | 75.7 /100 | #147 | Good 98.1% |
| Immigrants | Greece | 75.4 /100 | #148 | Good 98.1% |
| Apache | 73.2 /100 | #149 | Good 98.1% |
| Jordanians | 72.9 /100 | #150 | Good 98.1% |
| Soviet Union | 71.6 /100 | #151 | Good 98.0% |
| Dutch West Indians | 70.2 /100 | #152 | Good 98.0% |
| Immigrants | Moldova | 69.6 /100 | #153 | Good 98.0% |
| Immigrants | Iran | 68.7 /100 | #154 | Good 98.0% |
| Immigrants | South Central Asia | 66.7 /100 | #155 | Good 98.0% |
| Venezuelans | 66.6 /100 | #156 | Good 98.0% |
| Comanche | 66.0 /100 | #157 | Good 98.0% |