Immigrants from Denmark vs Paraguayan Nursery School
COMPARE
Immigrants from Denmark
Paraguayan
Nursery School
Nursery School Comparison
Immigrants from Denmark
Paraguayans
98.3%
NURSERY SCHOOL
99.1/ 100
METRIC RATING
84th/ 347
METRIC RANK
97.9%
NURSERY SCHOOL
27.4/ 100
METRIC RATING
193rd/ 347
METRIC RANK
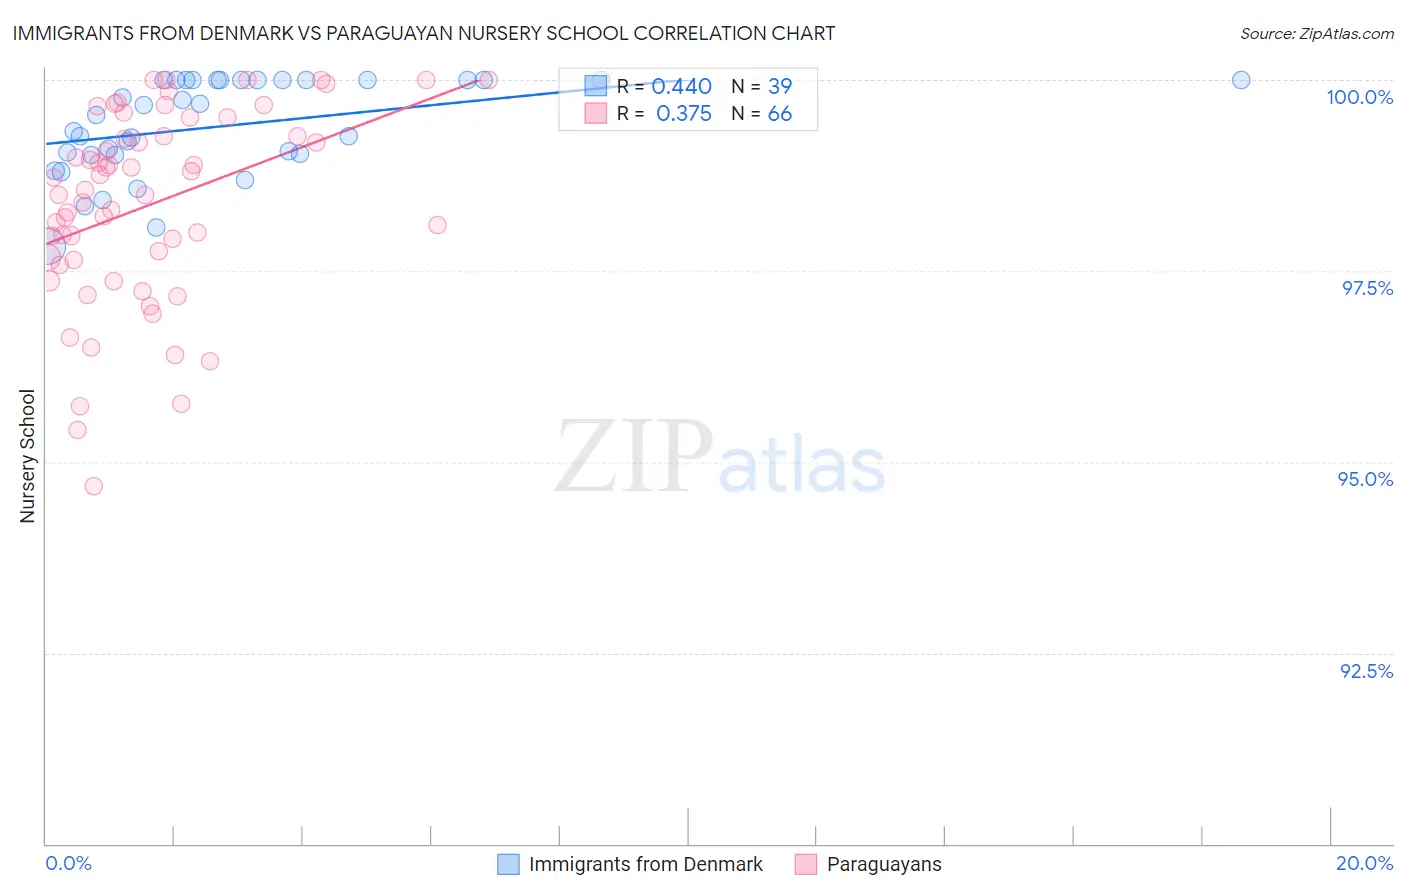
Immigrants from Denmark vs Paraguayan Nursery School Correlation Chart
The statistical analysis conducted on geographies consisting of 136,428,049 people shows a moderate positive correlation between the proportion of Immigrants from Denmark and percentage of population with at least nursery school education in the United States with a correlation coefficient (R) of 0.440 and weighted average of 98.3%. Similarly, the statistical analysis conducted on geographies consisting of 95,114,254 people shows a mild positive correlation between the proportion of Paraguayans and percentage of population with at least nursery school education in the United States with a correlation coefficient (R) of 0.375 and weighted average of 97.9%, a difference of 0.43%.
Nursery School Correlation Summary
| Measurement | Immigrants from Denmark | Paraguayan |
| Minimum | 97.8% | 94.7% |
| Maximum | 100.0% | 100.0% |
| Range | 2.2% | 5.3% |
| Mean | 99.4% | 98.4% |
| Median | 99.5% | 98.5% |
| Interquartile 25% (IQ1) | 99.0% | 97.6% |
| Interquartile 75% (IQ3) | 100.0% | 99.3% |
| Interquartile Range (IQR) | 0.98% | 1.6% |
| Standard Deviation (Sample) | 0.63% | 1.3% |
| Standard Deviation (Population) | 0.62% | 1.3% |
Similar Demographics by Nursery School
Demographics Similar to Immigrants from Denmark by Nursery School
In terms of nursery school, the demographic groups most similar to Immigrants from Denmark are Osage (98.3%, a difference of 0.0%), Immigrants from Sweden (98.3%, a difference of 0.0%), Shoshone (98.3%, a difference of 0.010%), Icelander (98.3%, a difference of 0.010%), and Potawatomi (98.3%, a difference of 0.010%).
| Demographics | Rating | Rank | Nursery School |
| Immigrants | Lithuania | 99.3 /100 | #77 | Exceptional 98.3% |
| Delaware | 99.3 /100 | #78 | Exceptional 98.3% |
| Immigrants | Belgium | 99.3 /100 | #79 | Exceptional 98.3% |
| Shoshone | 99.3 /100 | #80 | Exceptional 98.3% |
| Icelanders | 99.2 /100 | #81 | Exceptional 98.3% |
| Potawatomi | 99.2 /100 | #82 | Exceptional 98.3% |
| Osage | 99.1 /100 | #83 | Exceptional 98.3% |
| Immigrants | Denmark | 99.1 /100 | #84 | Exceptional 98.3% |
| Immigrants | Sweden | 99.1 /100 | #85 | Exceptional 98.3% |
| Immigrants | Australia | 99.0 /100 | #86 | Exceptional 98.3% |
| Hopi | 98.9 /100 | #87 | Exceptional 98.3% |
| Ukrainians | 98.9 /100 | #88 | Exceptional 98.3% |
| Immigrants | South Africa | 98.8 /100 | #89 | Exceptional 98.3% |
| Immigrants | Western Europe | 98.8 /100 | #90 | Exceptional 98.3% |
| Zimbabweans | 98.8 /100 | #91 | Exceptional 98.3% |
Demographics Similar to Paraguayans by Nursery School
In terms of nursery school, the demographic groups most similar to Paraguayans are Mongolian (97.9%, a difference of 0.0%), Hawaiian (97.9%, a difference of 0.0%), Immigrants from Taiwan (97.9%, a difference of 0.010%), Black/African American (97.9%, a difference of 0.010%), and Guamanian/Chamorro (97.9%, a difference of 0.010%).
| Demographics | Rating | Rank | Nursery School |
| Immigrants | Argentina | 40.8 /100 | #186 | Average 98.0% |
| Immigrants | Kazakhstan | 37.1 /100 | #187 | Fair 97.9% |
| Arabs | 34.7 /100 | #188 | Fair 97.9% |
| Pakistanis | 34.6 /100 | #189 | Fair 97.9% |
| Panamanians | 34.3 /100 | #190 | Fair 97.9% |
| Immigrants | Taiwan | 30.6 /100 | #191 | Fair 97.9% |
| Blacks/African Americans | 29.4 /100 | #192 | Fair 97.9% |
| Paraguayans | 27.4 /100 | #193 | Fair 97.9% |
| Mongolians | 27.3 /100 | #194 | Fair 97.9% |
| Hawaiians | 27.2 /100 | #195 | Fair 97.9% |
| Guamanians/Chamorros | 25.7 /100 | #196 | Fair 97.9% |
| Yuman | 25.7 /100 | #197 | Fair 97.9% |
| Immigrants | Kenya | 24.1 /100 | #198 | Fair 97.9% |
| Immigrants | Egypt | 22.5 /100 | #199 | Fair 97.9% |
| Tohono O'odham | 22.2 /100 | #200 | Fair 97.9% |