Immigrants from Denmark vs Immigrants from Scotland 6th Grade
COMPARE
Immigrants from Denmark
Immigrants from Scotland
6th Grade
6th Grade Comparison
Immigrants from Denmark
Immigrants from Scotland
97.5%
6TH GRADE
98.5/ 100
METRIC RATING
98th/ 347
METRIC RANK
97.8%
6TH GRADE
99.8/ 100
METRIC RATING
50th/ 347
METRIC RANK
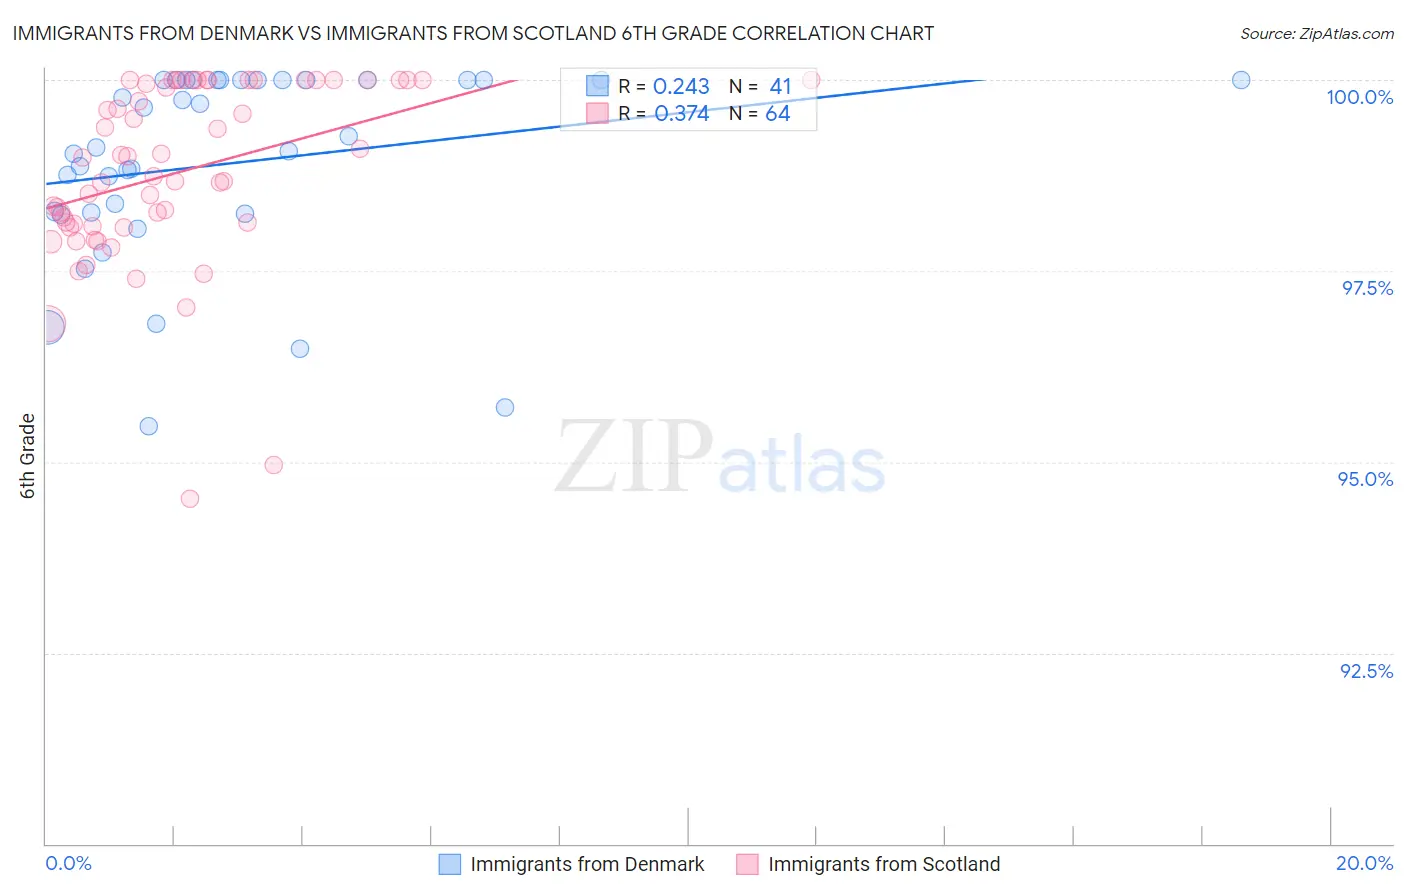
Immigrants from Denmark vs Immigrants from Scotland 6th Grade Correlation Chart
The statistical analysis conducted on geographies consisting of 136,430,932 people shows a weak positive correlation between the proportion of Immigrants from Denmark and percentage of population with at least 6th grade education in the United States with a correlation coefficient (R) of 0.243 and weighted average of 97.5%. Similarly, the statistical analysis conducted on geographies consisting of 196,398,887 people shows a mild positive correlation between the proportion of Immigrants from Scotland and percentage of population with at least 6th grade education in the United States with a correlation coefficient (R) of 0.374 and weighted average of 97.8%, a difference of 0.26%.
6th Grade Correlation Summary
| Measurement | Immigrants from Denmark | Immigrants from Scotland |
| Minimum | 95.5% | 94.5% |
| Maximum | 100.0% | 100.0% |
| Range | 4.5% | 5.5% |
| Mean | 98.9% | 98.8% |
| Median | 99.1% | 98.9% |
| Interquartile 25% (IQ1) | 98.3% | 98.1% |
| Interquartile 75% (IQ3) | 100.0% | 100.0% |
| Interquartile Range (IQR) | 1.7% | 1.9% |
| Standard Deviation (Sample) | 1.3% | 1.2% |
| Standard Deviation (Population) | 1.2% | 1.2% |
Similar Demographics by 6th Grade
Demographics Similar to Immigrants from Denmark by 6th Grade
In terms of 6th grade, the demographic groups most similar to Immigrants from Denmark are Yugoslavian (97.5%, a difference of 0.0%), Romanian (97.5%, a difference of 0.010%), Cree (97.5%, a difference of 0.010%), Cypriot (97.5%, a difference of 0.010%), and Immigrants from Ireland (97.5%, a difference of 0.010%).
| Demographics | Rating | Rank | 6th Grade |
| Immigrants | Western Europe | 98.8 /100 | #91 | Exceptional 97.5% |
| Romanians | 98.7 /100 | #92 | Exceptional 97.5% |
| Cree | 98.7 /100 | #93 | Exceptional 97.5% |
| Cypriots | 98.7 /100 | #94 | Exceptional 97.5% |
| Immigrants | Ireland | 98.7 /100 | #95 | Exceptional 97.5% |
| Immigrants | Germany | 98.6 /100 | #96 | Exceptional 97.5% |
| Immigrants | Sweden | 98.6 /100 | #97 | Exceptional 97.5% |
| Immigrants | Denmark | 98.5 /100 | #98 | Exceptional 97.5% |
| Yugoslavians | 98.5 /100 | #99 | Exceptional 97.5% |
| Turks | 98.3 /100 | #100 | Exceptional 97.5% |
| South Africans | 98.2 /100 | #101 | Exceptional 97.5% |
| Choctaw | 98.0 /100 | #102 | Exceptional 97.5% |
| Bhutanese | 98.0 /100 | #103 | Exceptional 97.5% |
| German Russians | 97.9 /100 | #104 | Exceptional 97.5% |
| Cheyenne | 97.9 /100 | #105 | Exceptional 97.5% |
Demographics Similar to Immigrants from Scotland by 6th Grade
In terms of 6th grade, the demographic groups most similar to Immigrants from Scotland are Native Hawaiian (97.8%, a difference of 0.0%), Celtic (97.8%, a difference of 0.0%), Estonian (97.8%, a difference of 0.0%), Arapaho (97.8%, a difference of 0.010%), and Maltese (97.8%, a difference of 0.010%).
| Demographics | Rating | Rank | 6th Grade |
| Northern Europeans | 99.9 /100 | #43 | Exceptional 97.8% |
| Czechoslovakians | 99.9 /100 | #44 | Exceptional 97.8% |
| Bulgarians | 99.9 /100 | #45 | Exceptional 97.8% |
| Arapaho | 99.9 /100 | #46 | Exceptional 97.8% |
| Native Hawaiians | 99.9 /100 | #47 | Exceptional 97.8% |
| Celtics | 99.9 /100 | #48 | Exceptional 97.8% |
| Estonians | 99.8 /100 | #49 | Exceptional 97.8% |
| Immigrants | Scotland | 99.8 /100 | #50 | Exceptional 97.8% |
| Maltese | 99.8 /100 | #51 | Exceptional 97.8% |
| Australians | 99.8 /100 | #52 | Exceptional 97.8% |
| Slavs | 99.8 /100 | #53 | Exceptional 97.8% |
| Creek | 99.8 /100 | #54 | Exceptional 97.7% |
| Aleuts | 99.8 /100 | #55 | Exceptional 97.7% |
| Austrians | 99.8 /100 | #56 | Exceptional 97.7% |
| Whites/Caucasians | 99.8 /100 | #57 | Exceptional 97.7% |