Immigrants from Czechoslovakia vs Swiss Median Male Earnings
COMPARE
Immigrants from Czechoslovakia
Swiss
Median Male Earnings
Median Male Earnings Comparison
Immigrants from Czechoslovakia
Swiss
$62,217
MEDIAN MALE EARNINGS
99.9/ 100
METRIC RATING
46th/ 347
METRIC RANK
$55,731
MEDIAN MALE EARNINGS
77.1/ 100
METRIC RATING
150th/ 347
METRIC RANK
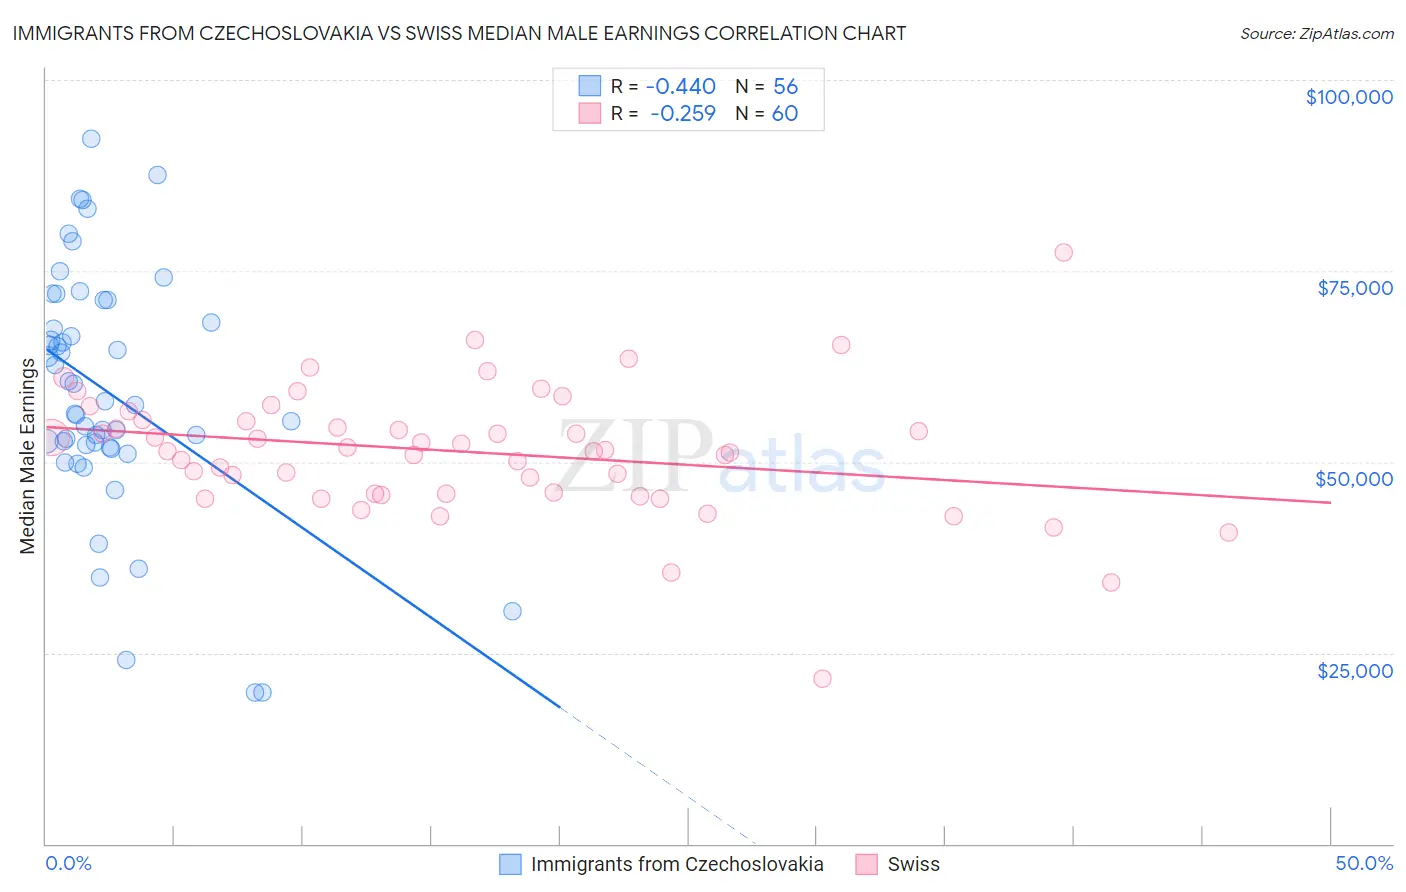
Immigrants from Czechoslovakia vs Swiss Median Male Earnings Correlation Chart
The statistical analysis conducted on geographies consisting of 195,431,341 people shows a moderate negative correlation between the proportion of Immigrants from Czechoslovakia and median male earnings in the United States with a correlation coefficient (R) of -0.440 and weighted average of $62,217. Similarly, the statistical analysis conducted on geographies consisting of 464,659,146 people shows a weak negative correlation between the proportion of Swiss and median male earnings in the United States with a correlation coefficient (R) of -0.259 and weighted average of $55,731, a difference of 11.6%.
Median Male Earnings Correlation Summary
| Measurement | Immigrants from Czechoslovakia | Swiss |
| Minimum | $19,792 | $21,563 |
| Maximum | $92,305 | $77,386 |
| Range | $72,513 | $55,823 |
| Mean | $59,087 | $51,336 |
| Median | $57,746 | $51,444 |
| Interquartile 25% (IQ1) | $51,971 | $45,855 |
| Interquartile 75% (IQ3) | $69,695 | $55,388 |
| Interquartile Range (IQR) | $17,724 | $9,533 |
| Standard Deviation (Sample) | $15,934 | $8,461 |
| Standard Deviation (Population) | $15,791 | $8,390 |
Similar Demographics by Median Male Earnings
Demographics Similar to Immigrants from Czechoslovakia by Median Male Earnings
In terms of median male earnings, the demographic groups most similar to Immigrants from Czechoslovakia are Immigrants from Austria ($62,164, a difference of 0.090%), Immigrants from Malaysia ($62,121, a difference of 0.15%), Bulgarian ($62,378, a difference of 0.26%), Immigrants from Europe ($62,057, a difference of 0.26%), and Cambodian ($62,516, a difference of 0.48%).
| Demographics | Rating | Rank | Median Male Earnings |
| Immigrants | South Africa | 100.0 /100 | #39 | Exceptional $62,899 |
| Australians | 100.0 /100 | #40 | Exceptional $62,857 |
| Immigrants | Turkey | 100.0 /100 | #41 | Exceptional $62,728 |
| Immigrants | Greece | 100.0 /100 | #42 | Exceptional $62,689 |
| Immigrants | Belarus | 100.0 /100 | #43 | Exceptional $62,658 |
| Cambodians | 100.0 /100 | #44 | Exceptional $62,516 |
| Bulgarians | 100.0 /100 | #45 | Exceptional $62,378 |
| Immigrants | Czechoslovakia | 99.9 /100 | #46 | Exceptional $62,217 |
| Immigrants | Austria | 99.9 /100 | #47 | Exceptional $62,164 |
| Immigrants | Malaysia | 99.9 /100 | #48 | Exceptional $62,121 |
| Immigrants | Europe | 99.9 /100 | #49 | Exceptional $62,057 |
| Bhutanese | 99.9 /100 | #50 | Exceptional $61,759 |
| Estonians | 99.9 /100 | #51 | Exceptional $61,710 |
| Immigrants | Norway | 99.9 /100 | #52 | Exceptional $61,628 |
| South Africans | 99.9 /100 | #53 | Exceptional $61,460 |
Demographics Similar to Swiss by Median Male Earnings
In terms of median male earnings, the demographic groups most similar to Swiss are English ($55,747, a difference of 0.030%), Immigrants from Oceania ($55,712, a difference of 0.030%), Scottish ($55,793, a difference of 0.11%), Peruvian ($55,659, a difference of 0.13%), and Immigrants from Philippines ($55,809, a difference of 0.14%).
| Demographics | Rating | Rank | Median Male Earnings |
| Sri Lankans | 83.4 /100 | #143 | Excellent $56,136 |
| Immigrants | Uganda | 82.4 /100 | #144 | Excellent $56,064 |
| Norwegians | 80.9 /100 | #145 | Excellent $55,965 |
| Immigrants | Chile | 80.7 /100 | #146 | Excellent $55,954 |
| Immigrants | Philippines | 78.4 /100 | #147 | Good $55,809 |
| Scottish | 78.2 /100 | #148 | Good $55,793 |
| English | 77.4 /100 | #149 | Good $55,747 |
| Swiss | 77.1 /100 | #150 | Good $55,731 |
| Immigrants | Oceania | 76.8 /100 | #151 | Good $55,712 |
| Peruvians | 75.8 /100 | #152 | Good $55,659 |
| Immigrants | Nepal | 75.0 /100 | #153 | Good $55,615 |
| Taiwanese | 73.9 /100 | #154 | Good $55,556 |
| Scandinavians | 73.4 /100 | #155 | Good $55,527 |
| Immigrants | Ethiopia | 71.6 /100 | #156 | Good $55,434 |
| Icelanders | 71.2 /100 | #157 | Good $55,415 |