Puget Sound Salish vs Seminole Professional Degree
COMPARE
Puget Sound Salish
Seminole
Professional Degree
Professional Degree Comparison
Puget Sound Salish
Seminole
3.1%
PROFESSIONAL DEGREE
0.0/ 100
METRIC RATING
333rd/ 347
METRIC RANK
3.2%
PROFESSIONAL DEGREE
0.1/ 100
METRIC RATING
320th/ 347
METRIC RANK
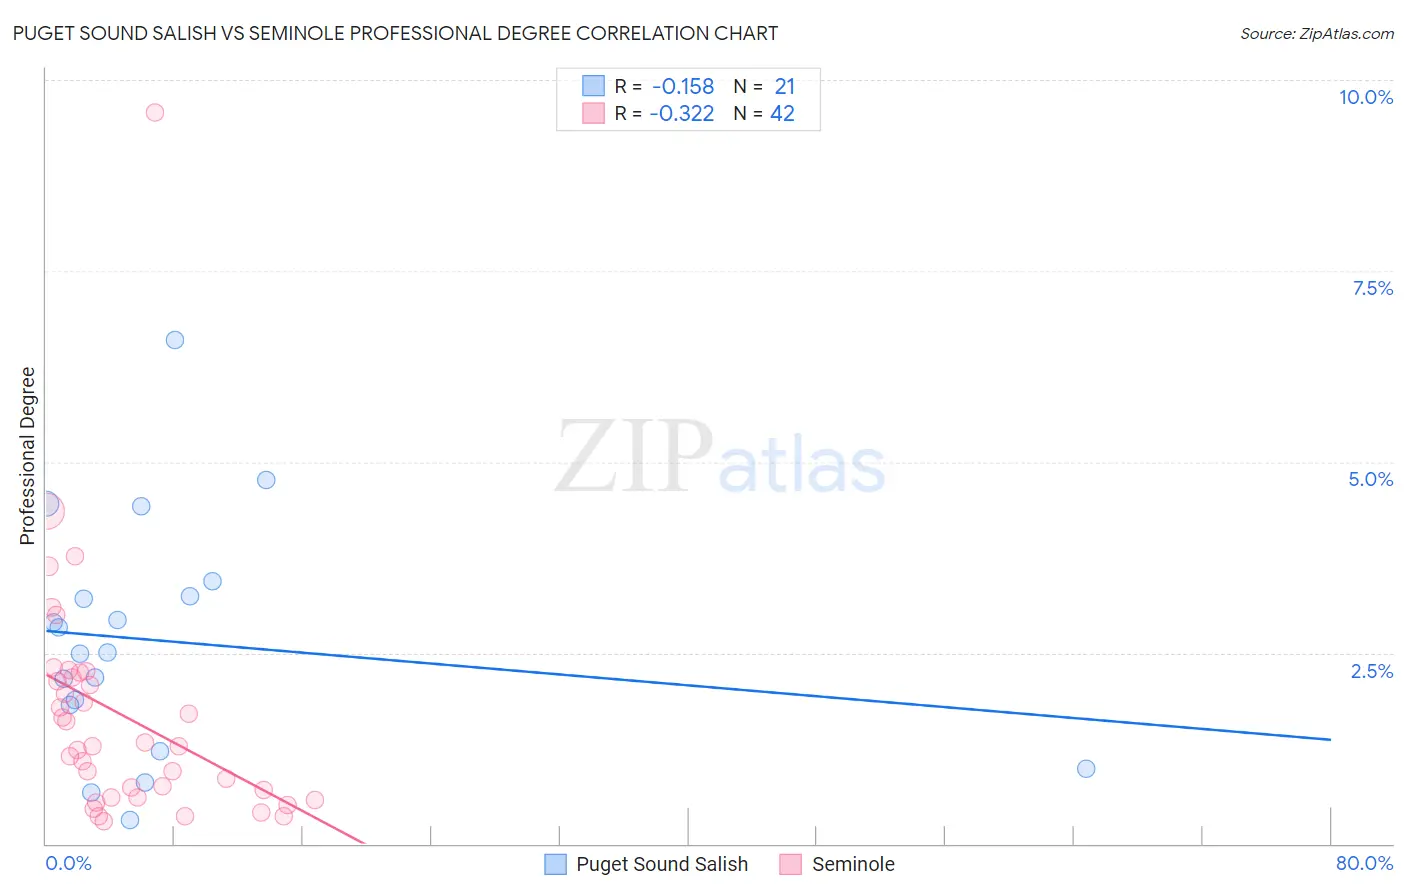
Puget Sound Salish vs Seminole Professional Degree Correlation Chart
The statistical analysis conducted on geographies consisting of 46,093,850 people shows a poor negative correlation between the proportion of Puget Sound Salish and percentage of population with at least professional degree education in the United States with a correlation coefficient (R) of -0.158 and weighted average of 3.1%. Similarly, the statistical analysis conducted on geographies consisting of 118,144,737 people shows a mild negative correlation between the proportion of Seminole and percentage of population with at least professional degree education in the United States with a correlation coefficient (R) of -0.322 and weighted average of 3.2%, a difference of 3.7%.
Professional Degree Correlation Summary
| Measurement | Puget Sound Salish | Seminole |
| Minimum | 0.31% | 0.30% |
| Maximum | 6.6% | 9.6% |
| Range | 6.3% | 9.3% |
| Mean | 2.7% | 1.7% |
| Median | 2.5% | 1.3% |
| Interquartile 25% (IQ1) | 1.5% | 0.61% |
| Interquartile 75% (IQ3) | 3.3% | 2.2% |
| Interquartile Range (IQR) | 1.8% | 1.6% |
| Standard Deviation (Sample) | 1.5% | 1.6% |
| Standard Deviation (Population) | 1.5% | 1.6% |
Demographics Similar to Puget Sound Salish and Seminole by Professional Degree
In terms of professional degree, the demographic groups most similar to Puget Sound Salish are Yakama (3.1%, a difference of 0.030%), Kiowa (3.1%, a difference of 0.14%), Immigrants from Cabo Verde (3.1%, a difference of 0.26%), Bangladeshi (3.1%, a difference of 0.34%), and Creek (3.1%, a difference of 0.55%). Similarly, the demographic groups most similar to Seminole are Tsimshian (3.2%, a difference of 0.36%), Hispanic or Latino (3.2%, a difference of 0.72%), Inupiat (3.2%, a difference of 0.80%), Crow (3.2%, a difference of 1.1%), and Choctaw (3.2%, a difference of 1.1%).
| Demographics | Rating | Rank | Professional Degree |
| Puerto Ricans | 0.1 /100 | #316 | Tragic 3.2% |
| Nepalese | 0.1 /100 | #317 | Tragic 3.2% |
| Immigrants | Micronesia | 0.1 /100 | #318 | Tragic 3.2% |
| Choctaw | 0.1 /100 | #319 | Tragic 3.2% |
| Seminole | 0.1 /100 | #320 | Tragic 3.2% |
| Tsimshian | 0.0 /100 | #321 | Tragic 3.2% |
| Hispanics or Latinos | 0.0 /100 | #322 | Tragic 3.2% |
| Inupiat | 0.0 /100 | #323 | Tragic 3.2% |
| Crow | 0.0 /100 | #324 | Tragic 3.2% |
| Yaqui | 0.0 /100 | #325 | Tragic 3.2% |
| Menominee | 0.0 /100 | #326 | Tragic 3.1% |
| Dutch West Indians | 0.0 /100 | #327 | Tragic 3.1% |
| Creek | 0.0 /100 | #328 | Tragic 3.1% |
| Bangladeshis | 0.0 /100 | #329 | Tragic 3.1% |
| Immigrants | Cabo Verde | 0.0 /100 | #330 | Tragic 3.1% |
| Kiowa | 0.0 /100 | #331 | Tragic 3.1% |
| Yakama | 0.0 /100 | #332 | Tragic 3.1% |
| Puget Sound Salish | 0.0 /100 | #333 | Tragic 3.1% |
| Pennsylvania Germans | 0.0 /100 | #334 | Tragic 3.0% |
| Natives/Alaskans | 0.0 /100 | #335 | Tragic 3.0% |
| Fijians | 0.0 /100 | #336 | Tragic 2.9% |