Immigrants from Cuba vs Immigrants from Peru College, Under 1 year
COMPARE
Immigrants from Cuba
Immigrants from Peru
College, Under 1 year
College, Under 1 year Comparison
Immigrants from Cuba
Immigrants from Peru
55.7%
COLLEGE, UNDER 1 YEAR
0.0/ 100
METRIC RATING
329th/ 347
METRIC RANK
63.1%
COLLEGE, UNDER 1 YEAR
4.0/ 100
METRIC RATING
225th/ 347
METRIC RANK
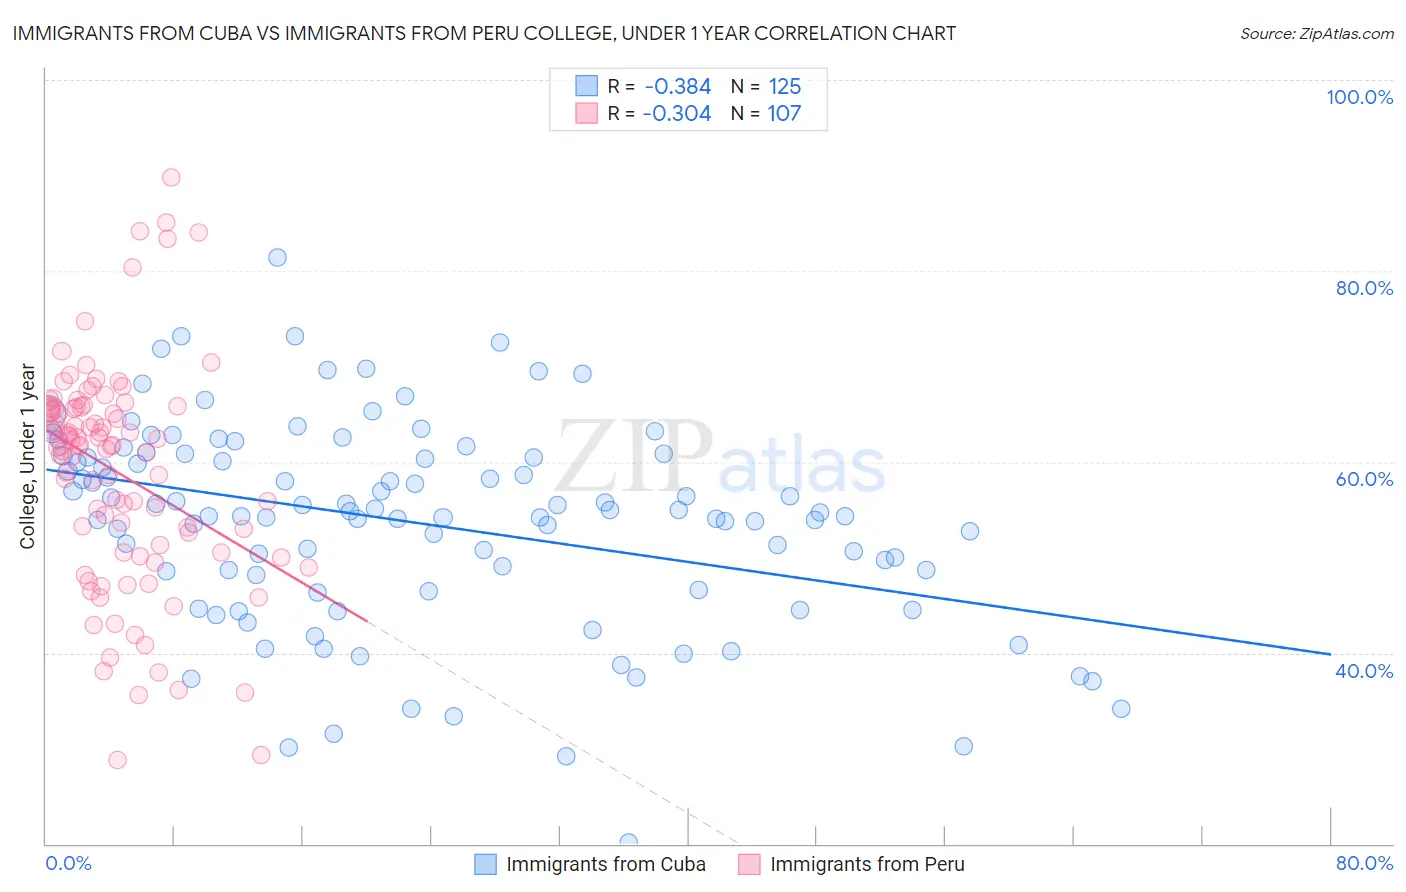
Immigrants from Cuba vs Immigrants from Peru College, Under 1 year Correlation Chart
The statistical analysis conducted on geographies consisting of 326,030,333 people shows a mild negative correlation between the proportion of Immigrants from Cuba and percentage of population with at least college, under 1 year education in the United States with a correlation coefficient (R) of -0.384 and weighted average of 55.7%. Similarly, the statistical analysis conducted on geographies consisting of 328,860,969 people shows a mild negative correlation between the proportion of Immigrants from Peru and percentage of population with at least college, under 1 year education in the United States with a correlation coefficient (R) of -0.304 and weighted average of 63.1%, a difference of 13.3%.
College, Under 1 year Correlation Summary
| Measurement | Immigrants from Cuba | Immigrants from Peru |
| Minimum | 20.1% | 28.8% |
| Maximum | 81.5% | 89.8% |
| Range | 61.4% | 61.0% |
| Mean | 53.6% | 58.9% |
| Median | 54.6% | 61.6% |
| Interquartile 25% (IQ1) | 47.4% | 50.5% |
| Interquartile 75% (IQ3) | 60.6% | 65.7% |
| Interquartile Range (IQR) | 13.2% | 15.3% |
| Standard Deviation (Sample) | 10.6% | 11.6% |
| Standard Deviation (Population) | 10.6% | 11.6% |
Similar Demographics by College, Under 1 year
Demographics Similar to Immigrants from Cuba by College, Under 1 year
In terms of college, under 1 year, the demographic groups most similar to Immigrants from Cuba are Mexican (55.6%, a difference of 0.13%), Dominican (55.5%, a difference of 0.40%), Cape Verdean (56.0%, a difference of 0.62%), Immigrants from Yemen (55.3%, a difference of 0.80%), and Immigrants from Guatemala (56.2%, a difference of 0.91%).
| Demographics | Rating | Rank | College, Under 1 year |
| Immigrants | Caribbean | 0.0 /100 | #322 | Tragic 56.6% |
| Immigrants | Honduras | 0.0 /100 | #323 | Tragic 56.5% |
| Immigrants | El Salvador | 0.0 /100 | #324 | Tragic 56.4% |
| Immigrants | Latin America | 0.0 /100 | #325 | Tragic 56.3% |
| Navajo | 0.0 /100 | #326 | Tragic 56.3% |
| Immigrants | Guatemala | 0.0 /100 | #327 | Tragic 56.2% |
| Cape Verdeans | 0.0 /100 | #328 | Tragic 56.0% |
| Immigrants | Cuba | 0.0 /100 | #329 | Tragic 55.7% |
| Mexicans | 0.0 /100 | #330 | Tragic 55.6% |
| Dominicans | 0.0 /100 | #331 | Tragic 55.5% |
| Immigrants | Yemen | 0.0 /100 | #332 | Tragic 55.3% |
| Yuman | 0.0 /100 | #333 | Tragic 55.1% |
| Immigrants | Azores | 0.0 /100 | #334 | Tragic 54.7% |
| Inupiat | 0.0 /100 | #335 | Tragic 54.6% |
| Pennsylvania Germans | 0.0 /100 | #336 | Tragic 54.5% |
Demographics Similar to Immigrants from Peru by College, Under 1 year
In terms of college, under 1 year, the demographic groups most similar to Immigrants from Peru are Immigrants from Colombia (63.1%, a difference of 0.020%), Subsaharan African (63.2%, a difference of 0.10%), Immigrants from Ghana (63.1%, a difference of 0.11%), Immigrants from Costa Rica (63.2%, a difference of 0.13%), and Samoan (63.0%, a difference of 0.22%).
| Demographics | Rating | Rank | College, Under 1 year |
| Immigrants | Panama | 5.7 /100 | #218 | Tragic 63.4% |
| Immigrants | Fiji | 5.7 /100 | #219 | Tragic 63.4% |
| Portuguese | 5.6 /100 | #220 | Tragic 63.4% |
| Cree | 5.2 /100 | #221 | Tragic 63.3% |
| Immigrants | Senegal | 5.0 /100 | #222 | Tragic 63.3% |
| Immigrants | Costa Rica | 4.5 /100 | #223 | Tragic 63.2% |
| Sub-Saharan Africans | 4.4 /100 | #224 | Tragic 63.2% |
| Immigrants | Peru | 4.0 /100 | #225 | Tragic 63.1% |
| Immigrants | Colombia | 4.0 /100 | #226 | Tragic 63.1% |
| Immigrants | Ghana | 3.7 /100 | #227 | Tragic 63.1% |
| Samoans | 3.3 /100 | #228 | Tragic 63.0% |
| Liberians | 3.2 /100 | #229 | Tragic 63.0% |
| Immigrants | Nonimmigrants | 3.0 /100 | #230 | Tragic 62.9% |
| Immigrants | Western Africa | 2.4 /100 | #231 | Tragic 62.8% |
| Osage | 2.2 /100 | #232 | Tragic 62.7% |