Chippewa vs Immigrants from Peru College, Under 1 year
COMPARE
Chippewa
Immigrants from Peru
College, Under 1 year
College, Under 1 year Comparison
Chippewa
Immigrants from Peru
62.6%
COLLEGE, UNDER 1 YEAR
2.0/ 100
METRIC RATING
234th/ 347
METRIC RANK
63.1%
COLLEGE, UNDER 1 YEAR
4.0/ 100
METRIC RATING
225th/ 347
METRIC RANK
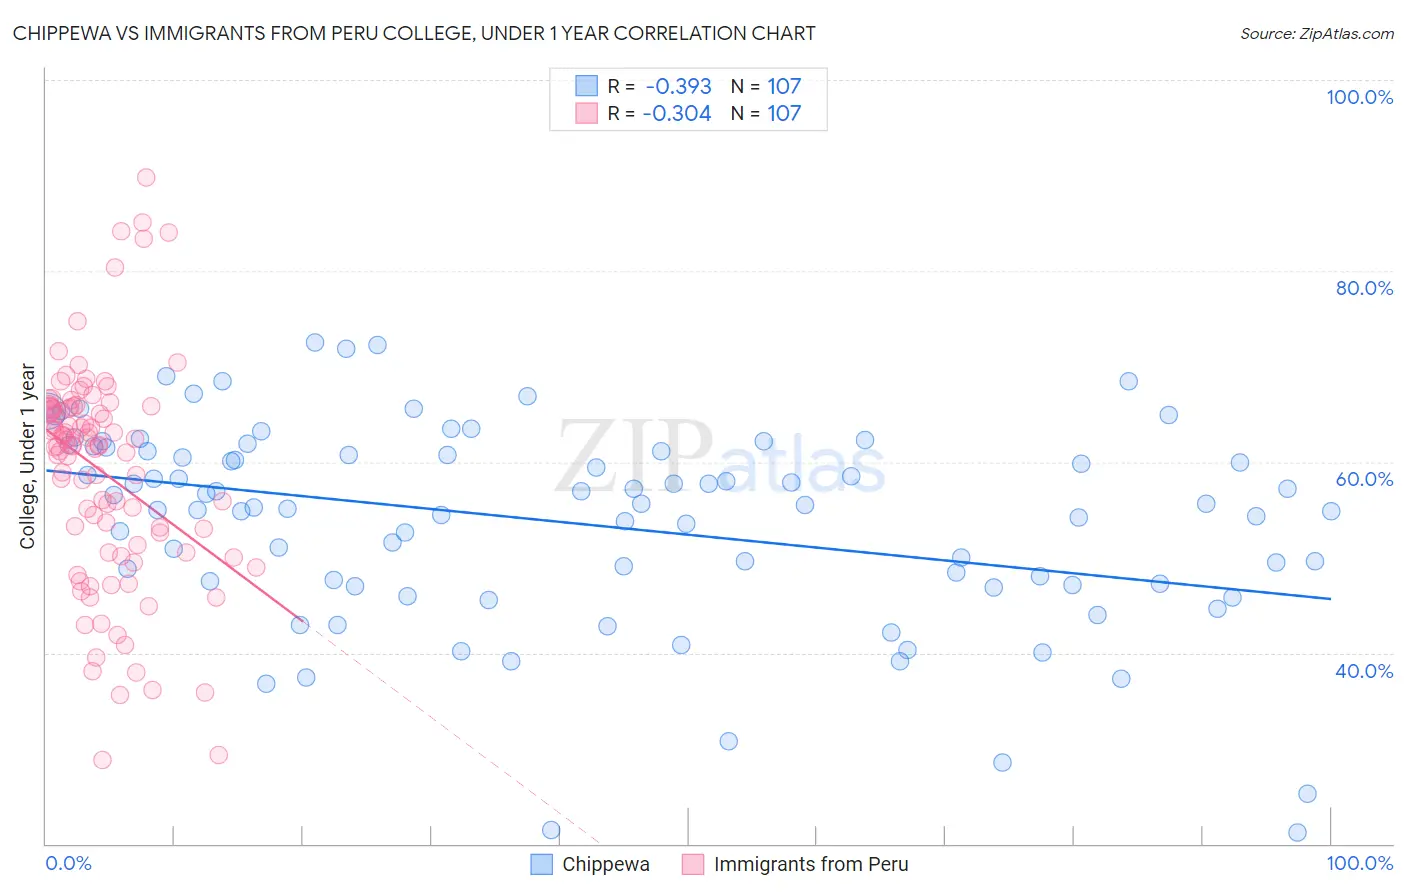
Chippewa vs Immigrants from Peru College, Under 1 year Correlation Chart
The statistical analysis conducted on geographies consisting of 215,068,018 people shows a mild negative correlation between the proportion of Chippewa and percentage of population with at least college, under 1 year education in the United States with a correlation coefficient (R) of -0.393 and weighted average of 62.6%. Similarly, the statistical analysis conducted on geographies consisting of 328,860,969 people shows a mild negative correlation between the proportion of Immigrants from Peru and percentage of population with at least college, under 1 year education in the United States with a correlation coefficient (R) of -0.304 and weighted average of 63.1%, a difference of 0.84%.
College, Under 1 year Correlation Summary
| Measurement | Chippewa | Immigrants from Peru |
| Minimum | 21.2% | 28.8% |
| Maximum | 72.5% | 89.8% |
| Range | 51.3% | 61.0% |
| Mean | 53.6% | 58.9% |
| Median | 55.5% | 61.6% |
| Interquartile 25% (IQ1) | 47.2% | 50.5% |
| Interquartile 75% (IQ3) | 61.1% | 65.7% |
| Interquartile Range (IQR) | 14.0% | 15.3% |
| Standard Deviation (Sample) | 10.5% | 11.6% |
| Standard Deviation (Population) | 10.5% | 11.6% |
Demographics Similar to Chippewa and Immigrants from Peru by College, Under 1 year
In terms of college, under 1 year, the demographic groups most similar to Chippewa are Iroquois (62.6%, a difference of 0.030%), Spanish American (62.6%, a difference of 0.050%), Osage (62.7%, a difference of 0.15%), Immigrants (62.5%, a difference of 0.18%), and Immigrants from Burma/Myanmar (62.5%, a difference of 0.21%). Similarly, the demographic groups most similar to Immigrants from Peru are Immigrants from Colombia (63.1%, a difference of 0.020%), Subsaharan African (63.2%, a difference of 0.10%), Immigrants from Ghana (63.1%, a difference of 0.11%), Immigrants from Costa Rica (63.2%, a difference of 0.13%), and Samoan (63.0%, a difference of 0.22%).
| Demographics | Rating | Rank | College, Under 1 year |
| Immigrants | Fiji | 5.7 /100 | #219 | Tragic 63.4% |
| Portuguese | 5.6 /100 | #220 | Tragic 63.4% |
| Cree | 5.2 /100 | #221 | Tragic 63.3% |
| Immigrants | Senegal | 5.0 /100 | #222 | Tragic 63.3% |
| Immigrants | Costa Rica | 4.5 /100 | #223 | Tragic 63.2% |
| Sub-Saharan Africans | 4.4 /100 | #224 | Tragic 63.2% |
| Immigrants | Peru | 4.0 /100 | #225 | Tragic 63.1% |
| Immigrants | Colombia | 4.0 /100 | #226 | Tragic 63.1% |
| Immigrants | Ghana | 3.7 /100 | #227 | Tragic 63.1% |
| Samoans | 3.3 /100 | #228 | Tragic 63.0% |
| Liberians | 3.2 /100 | #229 | Tragic 63.0% |
| Immigrants | Nonimmigrants | 3.0 /100 | #230 | Tragic 62.9% |
| Immigrants | Western Africa | 2.4 /100 | #231 | Tragic 62.8% |
| Osage | 2.2 /100 | #232 | Tragic 62.7% |
| Iroquois | 2.0 /100 | #233 | Tragic 62.6% |
| Chippewa | 2.0 /100 | #234 | Tragic 62.6% |
| Spanish Americans | 1.9 /100 | #235 | Tragic 62.6% |
| Immigrants | Immigrants | 1.7 /100 | #236 | Tragic 62.5% |
| Immigrants | Burma/Myanmar | 1.6 /100 | #237 | Tragic 62.5% |
| French American Indians | 1.5 /100 | #238 | Tragic 62.4% |
| Nepalese | 1.1 /100 | #239 | Tragic 62.2% |