Immigrants from Croatia vs Icelander 9th Grade
COMPARE
Immigrants from Croatia
Icelander
9th Grade
9th Grade Comparison
Immigrants from Croatia
Icelanders
95.4%
9TH GRADE
96.2/ 100
METRIC RATING
112th/ 347
METRIC RANK
95.7%
9TH GRADE
99.1/ 100
METRIC RATING
85th/ 347
METRIC RANK
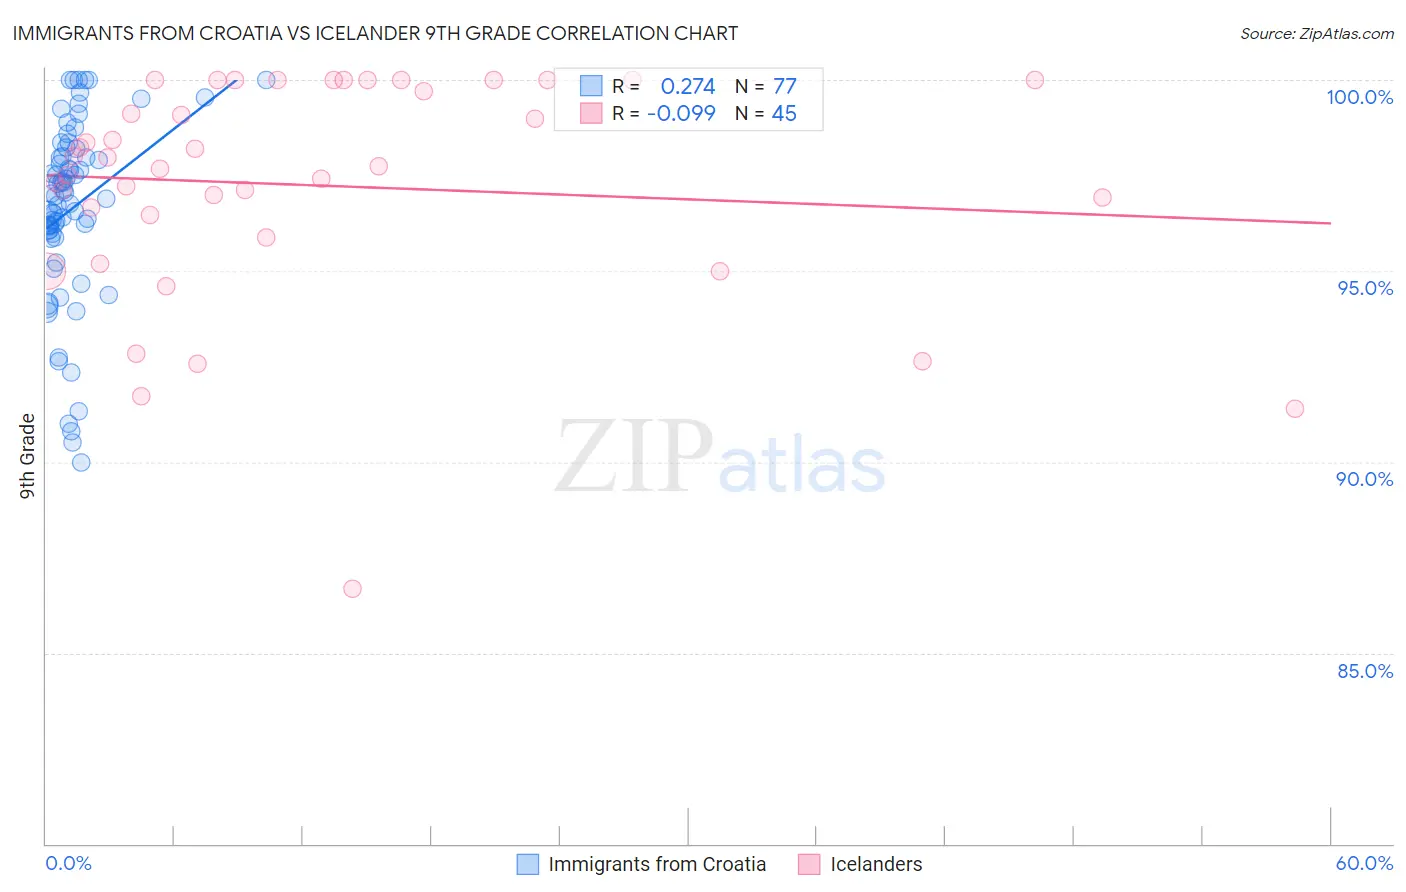
Immigrants from Croatia vs Icelander 9th Grade Correlation Chart
The statistical analysis conducted on geographies consisting of 132,548,291 people shows a weak positive correlation between the proportion of Immigrants from Croatia and percentage of population with at least 9th grade education in the United States with a correlation coefficient (R) of 0.274 and weighted average of 95.4%. Similarly, the statistical analysis conducted on geographies consisting of 159,667,064 people shows a slight negative correlation between the proportion of Icelanders and percentage of population with at least 9th grade education in the United States with a correlation coefficient (R) of -0.099 and weighted average of 95.7%, a difference of 0.27%.
9th Grade Correlation Summary
| Measurement | Immigrants from Croatia | Icelander |
| Minimum | 90.0% | 86.7% |
| Maximum | 100.0% | 100.0% |
| Range | 10.0% | 13.3% |
| Mean | 96.6% | 97.2% |
| Median | 97.0% | 97.7% |
| Interquartile 25% (IQ1) | 95.9% | 96.2% |
| Interquartile 75% (IQ3) | 98.1% | 100.0% |
| Interquartile Range (IQR) | 2.2% | 3.8% |
| Standard Deviation (Sample) | 2.4% | 2.9% |
| Standard Deviation (Population) | 2.4% | 2.9% |
Similar Demographics by 9th Grade
Demographics Similar to Immigrants from Croatia by 9th Grade
In terms of 9th grade, the demographic groups most similar to Immigrants from Croatia are Cherokee (95.4%, a difference of 0.0%), Iroquois (95.4%, a difference of 0.0%), German Russian (95.4%, a difference of 0.010%), Burmese (95.4%, a difference of 0.010%), and Immigrants from Europe (95.4%, a difference of 0.020%).
| Demographics | Rating | Rank | 9th Grade |
| Immigrants | France | 97.4 /100 | #105 | Exceptional 95.5% |
| Immigrants | Norway | 97.1 /100 | #106 | Exceptional 95.5% |
| Immigrants | Zimbabwe | 96.9 /100 | #107 | Exceptional 95.5% |
| Chickasaw | 96.8 /100 | #108 | Exceptional 95.5% |
| Osage | 96.8 /100 | #109 | Exceptional 95.5% |
| Immigrants | Bulgaria | 96.7 /100 | #110 | Exceptional 95.5% |
| Cherokee | 96.3 /100 | #111 | Exceptional 95.4% |
| Immigrants | Croatia | 96.2 /100 | #112 | Exceptional 95.4% |
| Iroquois | 96.2 /100 | #113 | Exceptional 95.4% |
| German Russians | 96.1 /100 | #114 | Exceptional 95.4% |
| Burmese | 96.0 /100 | #115 | Exceptional 95.4% |
| Immigrants | Europe | 95.7 /100 | #116 | Exceptional 95.4% |
| Immigrants | Romania | 95.6 /100 | #117 | Exceptional 95.4% |
| Immigrants | Turkey | 95.6 /100 | #118 | Exceptional 95.4% |
| Soviet Union | 95.6 /100 | #119 | Exceptional 95.4% |
Demographics Similar to Icelanders by 9th Grade
In terms of 9th grade, the demographic groups most similar to Icelanders are Immigrants from Denmark (95.7%, a difference of 0.0%), Immigrants from Western Europe (95.7%, a difference of 0.0%), Swiss (95.7%, a difference of 0.010%), Bhutanese (95.7%, a difference of 0.030%), and Arapaho (95.7%, a difference of 0.030%).
| Demographics | Rating | Rank | 9th Grade |
| Immigrants | South Africa | 99.4 /100 | #78 | Exceptional 95.8% |
| Romanians | 99.3 /100 | #79 | Exceptional 95.7% |
| Bhutanese | 99.3 /100 | #80 | Exceptional 95.7% |
| Arapaho | 99.3 /100 | #81 | Exceptional 95.7% |
| Puget Sound Salish | 99.2 /100 | #82 | Exceptional 95.7% |
| Swiss | 99.2 /100 | #83 | Exceptional 95.7% |
| Immigrants | Denmark | 99.1 /100 | #84 | Exceptional 95.7% |
| Icelanders | 99.1 /100 | #85 | Exceptional 95.7% |
| Immigrants | Western Europe | 99.1 /100 | #86 | Exceptional 95.7% |
| Okinawans | 99.0 /100 | #87 | Exceptional 95.7% |
| Immigrants | Czechoslovakia | 98.9 /100 | #88 | Exceptional 95.7% |
| Yugoslavians | 98.9 /100 | #89 | Exceptional 95.7% |
| South Africans | 98.8 /100 | #90 | Exceptional 95.6% |
| Creek | 98.8 /100 | #91 | Exceptional 95.6% |
| Immigrants | Saudi Arabia | 98.8 /100 | #92 | Exceptional 95.6% |