Immigrants from Costa Rica vs Immigrants from Asia College, 1 year or more
COMPARE
Immigrants from Costa Rica
Immigrants from Asia
College, 1 year or more
College, 1 year or more Comparison
Immigrants from Costa Rica
Immigrants from Asia
57.5%
COLLEGE, 1 YEAR OR MORE
8.0/ 100
METRIC RATING
220th/ 347
METRIC RANK
64.0%
COLLEGE, 1 YEAR OR MORE
99.7/ 100
METRIC RATING
58th/ 347
METRIC RANK
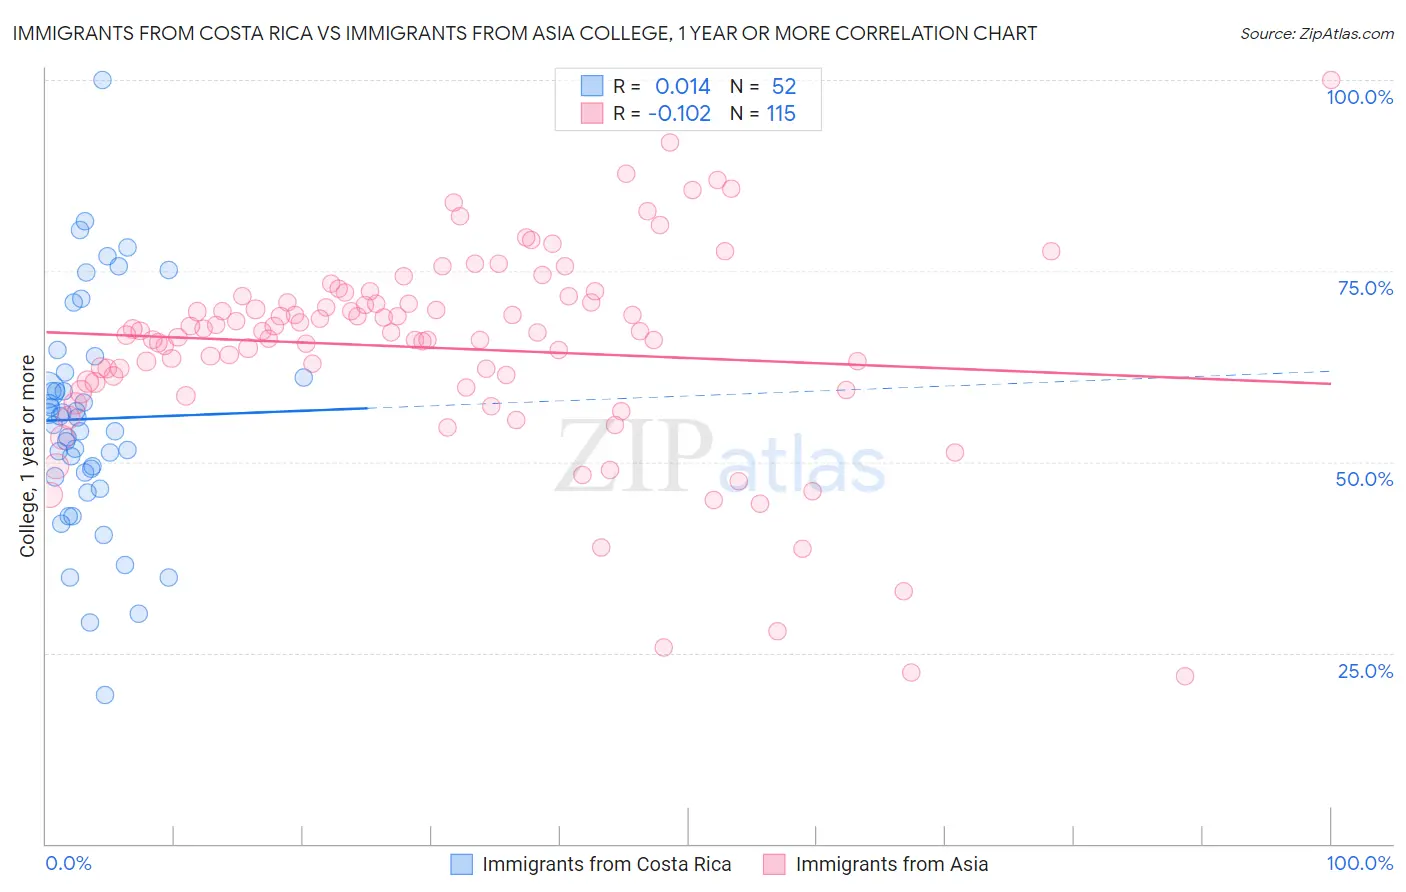
Immigrants from Costa Rica vs Immigrants from Asia College, 1 year or more Correlation Chart
The statistical analysis conducted on geographies consisting of 204,277,408 people shows no correlation between the proportion of Immigrants from Costa Rica and percentage of population with at least college, 1 year or more education in the United States with a correlation coefficient (R) of 0.014 and weighted average of 57.5%. Similarly, the statistical analysis conducted on geographies consisting of 549,164,299 people shows a poor negative correlation between the proportion of Immigrants from Asia and percentage of population with at least college, 1 year or more education in the United States with a correlation coefficient (R) of -0.102 and weighted average of 64.0%, a difference of 11.3%.
College, 1 year or more Correlation Summary
| Measurement | Immigrants from Costa Rica | Immigrants from Asia |
| Minimum | 19.5% | 22.0% |
| Maximum | 100.0% | 100.0% |
| Range | 80.5% | 78.0% |
| Mean | 55.6% | 64.9% |
| Median | 55.4% | 67.0% |
| Interquartile 25% (IQ1) | 48.3% | 60.3% |
| Interquartile 75% (IQ3) | 61.4% | 70.9% |
| Interquartile Range (IQR) | 13.0% | 10.6% |
| Standard Deviation (Sample) | 14.8% | 13.3% |
| Standard Deviation (Population) | 14.7% | 13.3% |
Similar Demographics by College, 1 year or more
Demographics Similar to Immigrants from Costa Rica by College, 1 year or more
In terms of college, 1 year or more, the demographic groups most similar to Immigrants from Costa Rica are Immigrants from Ghana (57.4%, a difference of 0.070%), White/Caucasian (57.6%, a difference of 0.12%), Native Hawaiian (57.6%, a difference of 0.18%), Immigrants from Panama (57.6%, a difference of 0.19%), and Subsaharan African (57.3%, a difference of 0.41%).
| Demographics | Rating | Rank | College, 1 year or more |
| French Canadians | 11.8 /100 | #213 | Poor 57.8% |
| Immigrants | Colombia | 11.6 /100 | #214 | Poor 57.8% |
| Tongans | 11.6 /100 | #215 | Poor 57.8% |
| Immigrants | Peru | 10.6 /100 | #216 | Poor 57.7% |
| Immigrants | Panama | 9.1 /100 | #217 | Tragic 57.6% |
| Native Hawaiians | 9.0 /100 | #218 | Tragic 57.6% |
| Whites/Caucasians | 8.7 /100 | #219 | Tragic 57.6% |
| Immigrants | Costa Rica | 8.0 /100 | #220 | Tragic 57.5% |
| Immigrants | Ghana | 7.7 /100 | #221 | Tragic 57.4% |
| Sub-Saharan Africans | 6.1 /100 | #222 | Tragic 57.3% |
| Portuguese | 5.4 /100 | #223 | Tragic 57.2% |
| Hmong | 5.4 /100 | #224 | Tragic 57.2% |
| Vietnamese | 4.7 /100 | #225 | Tragic 57.0% |
| Immigrants | Western Africa | 4.6 /100 | #226 | Tragic 57.0% |
| Immigrants | Immigrants | 4.4 /100 | #227 | Tragic 57.0% |
Demographics Similar to Immigrants from Asia by College, 1 year or more
In terms of college, 1 year or more, the demographic groups most similar to Immigrants from Asia are South African (64.1%, a difference of 0.14%), Immigrants from Czechoslovakia (64.1%, a difference of 0.15%), Immigrants from Belarus (64.1%, a difference of 0.18%), Zimbabwean (64.2%, a difference of 0.30%), and Asian (64.2%, a difference of 0.33%).
| Demographics | Rating | Rank | College, 1 year or more |
| Immigrants | Malaysia | 99.8 /100 | #51 | Exceptional 64.3% |
| Immigrants | Netherlands | 99.8 /100 | #52 | Exceptional 64.2% |
| Asians | 99.8 /100 | #53 | Exceptional 64.2% |
| Zimbabweans | 99.8 /100 | #54 | Exceptional 64.2% |
| Immigrants | Belarus | 99.7 /100 | #55 | Exceptional 64.1% |
| Immigrants | Czechoslovakia | 99.7 /100 | #56 | Exceptional 64.1% |
| South Africans | 99.7 /100 | #57 | Exceptional 64.1% |
| Immigrants | Asia | 99.7 /100 | #58 | Exceptional 64.0% |
| Immigrants | Serbia | 99.6 /100 | #59 | Exceptional 63.8% |
| Immigrants | Kazakhstan | 99.5 /100 | #60 | Exceptional 63.6% |
| Bolivians | 99.5 /100 | #61 | Exceptional 63.5% |
| Immigrants | Indonesia | 99.5 /100 | #62 | Exceptional 63.5% |
| Immigrants | Scotland | 99.4 /100 | #63 | Exceptional 63.4% |
| Immigrants | Spain | 99.4 /100 | #64 | Exceptional 63.4% |
| Maltese | 99.3 /100 | #65 | Exceptional 63.4% |