Immigrants from Congo vs Jordanian 2nd Grade
COMPARE
Immigrants from Congo
Jordanian
2nd Grade
2nd Grade Comparison
Immigrants from Congo
Jordanians
97.5%
2ND GRADE
0.6/ 100
METRIC RATING
255th/ 347
METRIC RANK
98.0%
2ND GRADE
74.5/ 100
METRIC RATING
148th/ 347
METRIC RANK
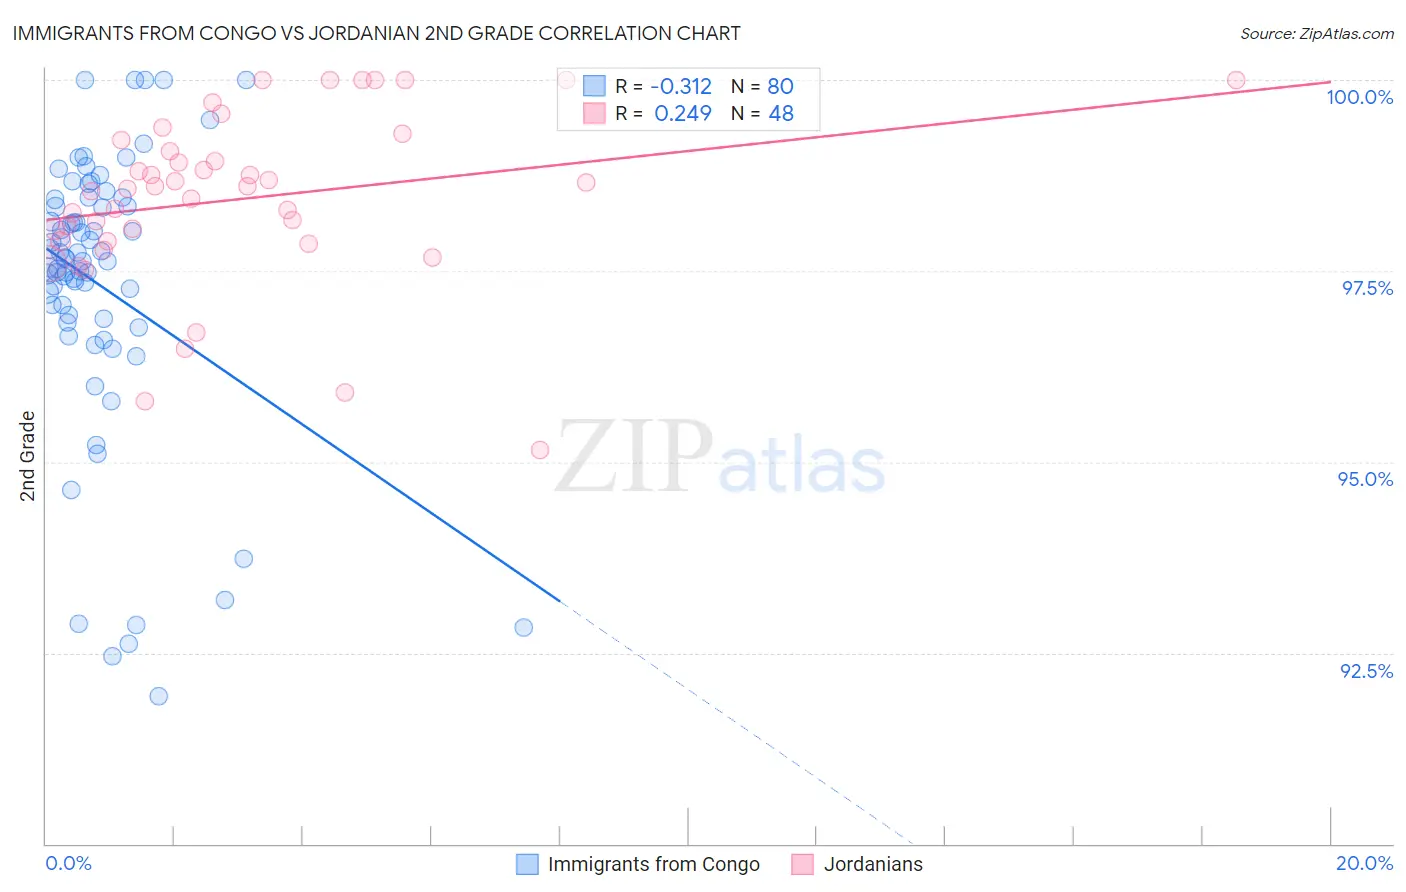
Immigrants from Congo vs Jordanian 2nd Grade Correlation Chart
The statistical analysis conducted on geographies consisting of 92,124,753 people shows a mild negative correlation between the proportion of Immigrants from Congo and percentage of population with at least 2nd grade education in the United States with a correlation coefficient (R) of -0.312 and weighted average of 97.5%. Similarly, the statistical analysis conducted on geographies consisting of 166,423,717 people shows a weak positive correlation between the proportion of Jordanians and percentage of population with at least 2nd grade education in the United States with a correlation coefficient (R) of 0.249 and weighted average of 98.0%, a difference of 0.49%.
2nd Grade Correlation Summary
| Measurement | Immigrants from Congo | Jordanian |
| Minimum | 91.9% | 95.2% |
| Maximum | 100.0% | 100.0% |
| Range | 8.1% | 4.8% |
| Mean | 97.3% | 98.4% |
| Median | 97.6% | 98.6% |
| Interquartile 25% (IQ1) | 96.8% | 97.9% |
| Interquartile 75% (IQ3) | 98.4% | 99.1% |
| Interquartile Range (IQR) | 1.5% | 1.3% |
| Standard Deviation (Sample) | 1.8% | 1.1% |
| Standard Deviation (Population) | 1.8% | 1.1% |
Similar Demographics by 2nd Grade
Demographics Similar to Immigrants from Congo by 2nd Grade
In terms of 2nd grade, the demographic groups most similar to Immigrants from Congo are Indian (Asian) (97.5%, a difference of 0.0%), Jamaican (97.5%, a difference of 0.0%), Puerto Rican (97.5%, a difference of 0.010%), Immigrants from Colombia (97.5%, a difference of 0.010%), and Yaqui (97.5%, a difference of 0.010%).
| Demographics | Rating | Rank | 2nd Grade |
| Immigrants | Middle Africa | 0.9 /100 | #248 | Tragic 97.5% |
| Bolivians | 0.9 /100 | #249 | Tragic 97.5% |
| Peruvians | 0.9 /100 | #250 | Tragic 97.5% |
| Immigrants | Africa | 0.8 /100 | #251 | Tragic 97.5% |
| Immigrants | Asia | 0.7 /100 | #252 | Tragic 97.5% |
| Puerto Ricans | 0.7 /100 | #253 | Tragic 97.5% |
| Indians (Asian) | 0.6 /100 | #254 | Tragic 97.5% |
| Immigrants | Congo | 0.6 /100 | #255 | Tragic 97.5% |
| Jamaicans | 0.6 /100 | #256 | Tragic 97.5% |
| Immigrants | Colombia | 0.5 /100 | #257 | Tragic 97.5% |
| Yaqui | 0.5 /100 | #258 | Tragic 97.5% |
| Fijians | 0.5 /100 | #259 | Tragic 97.5% |
| Assyrians/Chaldeans/Syriacs | 0.5 /100 | #260 | Tragic 97.5% |
| Armenians | 0.5 /100 | #261 | Tragic 97.5% |
| Taiwanese | 0.4 /100 | #262 | Tragic 97.4% |
Demographics Similar to Jordanians by 2nd Grade
In terms of 2nd grade, the demographic groups most similar to Jordanians are Apache (97.9%, a difference of 0.0%), Immigrants from Greece (98.0%, a difference of 0.010%), Immigrants from Moldova (97.9%, a difference of 0.010%), Hmong (98.0%, a difference of 0.020%), and Filipino (98.0%, a difference of 0.020%).
| Demographics | Rating | Rank | 2nd Grade |
| Immigrants | Turkey | 83.0 /100 | #141 | Excellent 98.0% |
| Burmese | 81.0 /100 | #142 | Excellent 98.0% |
| Alsatians | 80.5 /100 | #143 | Excellent 98.0% |
| Hmong | 80.0 /100 | #144 | Good 98.0% |
| Filipinos | 79.2 /100 | #145 | Good 98.0% |
| Immigrants | Israel | 78.0 /100 | #146 | Good 98.0% |
| Immigrants | Greece | 76.8 /100 | #147 | Good 98.0% |
| Jordanians | 74.5 /100 | #148 | Good 98.0% |
| Apache | 74.0 /100 | #149 | Good 97.9% |
| Immigrants | Moldova | 72.9 /100 | #150 | Good 97.9% |
| Soviet Union | 70.7 /100 | #151 | Good 97.9% |
| Immigrants | North Macedonia | 68.5 /100 | #152 | Good 97.9% |
| Immigrants | South Central Asia | 68.3 /100 | #153 | Good 97.9% |
| Marshallese | 67.7 /100 | #154 | Good 97.9% |
| French American Indians | 64.3 /100 | #155 | Good 97.9% |