Immigrants from Congo vs Jordanian Divorced or Separated
COMPARE
Immigrants from Congo
Jordanian
Divorced or Separated
Divorced or Separated Comparison
Immigrants from Congo
Jordanians
13.5%
DIVORCED OR SEPARATED
0.0/ 100
METRIC RATING
326th/ 347
METRIC RANK
11.5%
DIVORCED OR SEPARATED
99.6/ 100
METRIC RATING
72nd/ 347
METRIC RANK
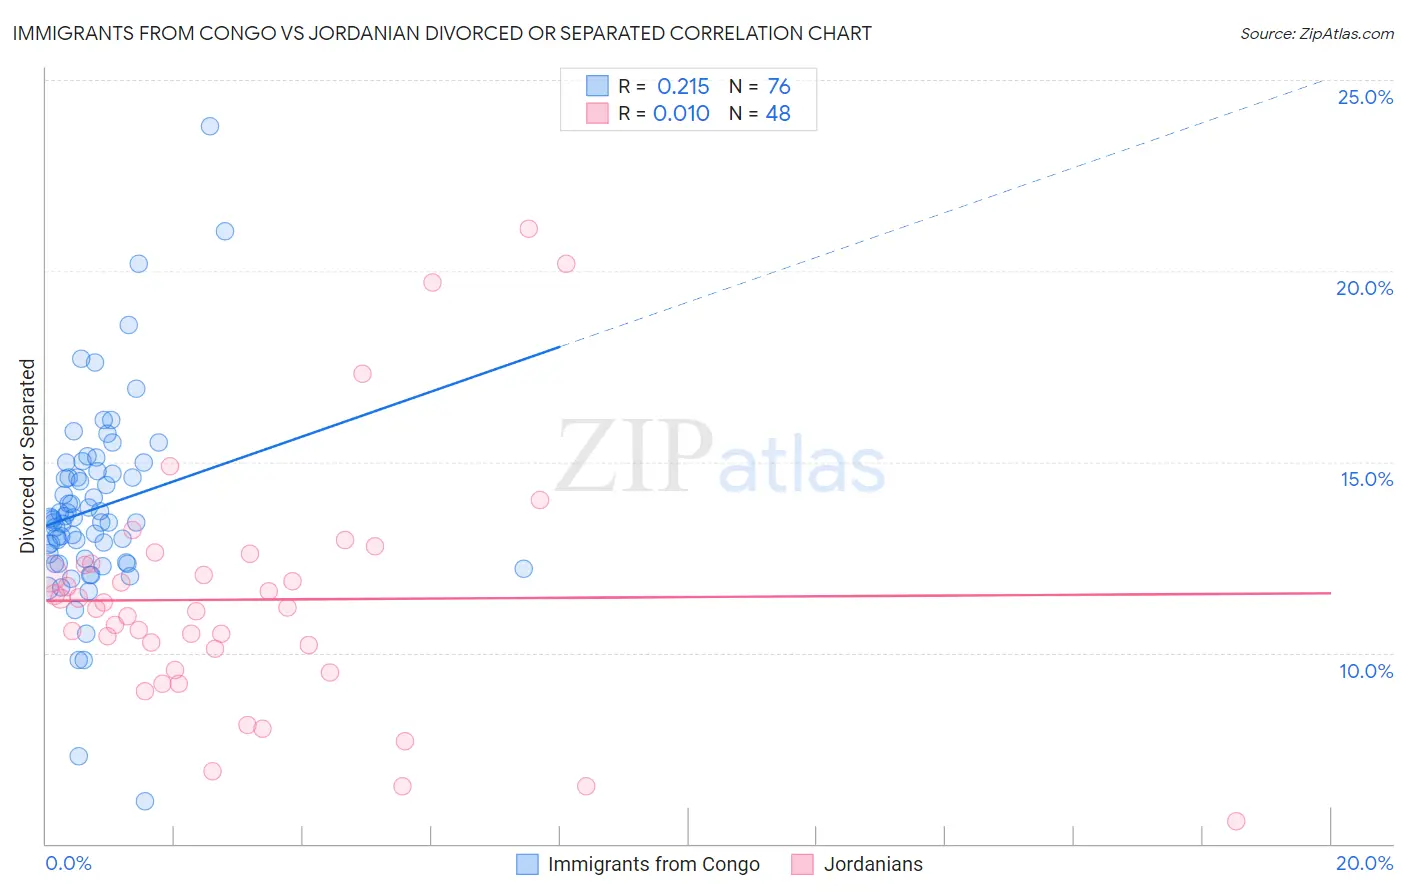
Immigrants from Congo vs Jordanian Divorced or Separated Correlation Chart
The statistical analysis conducted on geographies consisting of 92,097,616 people shows a weak positive correlation between the proportion of Immigrants from Congo and percentage of population currently divorced or separated in the United States with a correlation coefficient (R) of 0.215 and weighted average of 13.5%. Similarly, the statistical analysis conducted on geographies consisting of 166,386,288 people shows no correlation between the proportion of Jordanians and percentage of population currently divorced or separated in the United States with a correlation coefficient (R) of 0.010 and weighted average of 11.5%, a difference of 17.3%.
Divorced or Separated Correlation Summary
| Measurement | Immigrants from Congo | Jordanian |
| Minimum | 6.1% | 5.6% |
| Maximum | 23.8% | 21.1% |
| Range | 17.7% | 15.5% |
| Mean | 13.8% | 11.4% |
| Median | 13.5% | 11.2% |
| Interquartile 25% (IQ1) | 12.4% | 9.8% |
| Interquartile 75% (IQ3) | 14.7% | 12.3% |
| Interquartile Range (IQR) | 2.3% | 2.5% |
| Standard Deviation (Sample) | 2.6% | 3.2% |
| Standard Deviation (Population) | 2.6% | 3.2% |
Similar Demographics by Divorced or Separated
Demographics Similar to Immigrants from Congo by Divorced or Separated
In terms of divorced or separated, the demographic groups most similar to Immigrants from Congo are Potawatomi (13.5%, a difference of 0.010%), Osage (13.4%, a difference of 0.070%), U.S. Virgin Islander (13.4%, a difference of 0.14%), Immigrants from Haiti (13.4%, a difference of 0.36%), and Comanche (13.5%, a difference of 0.48%).
| Demographics | Rating | Rank | Divorced or Separated |
| Puget Sound Salish | 0.0 /100 | #319 | Tragic 13.4% |
| Cajuns | 0.0 /100 | #320 | Tragic 13.4% |
| Cheyenne | 0.0 /100 | #321 | Tragic 13.4% |
| Immigrants | Haiti | 0.0 /100 | #322 | Tragic 13.4% |
| U.S. Virgin Islanders | 0.0 /100 | #323 | Tragic 13.4% |
| Osage | 0.0 /100 | #324 | Tragic 13.4% |
| Potawatomi | 0.0 /100 | #325 | Tragic 13.5% |
| Immigrants | Congo | 0.0 /100 | #326 | Tragic 13.5% |
| Comanche | 0.0 /100 | #327 | Tragic 13.5% |
| Immigrants | Caribbean | 0.0 /100 | #328 | Tragic 13.6% |
| Houma | 0.0 /100 | #329 | Tragic 13.6% |
| Paiute | 0.0 /100 | #330 | Tragic 13.6% |
| Blacks/African Americans | 0.0 /100 | #331 | Tragic 13.6% |
| Cherokee | 0.0 /100 | #332 | Tragic 13.7% |
| Puerto Ricans | 0.0 /100 | #333 | Tragic 13.9% |
Demographics Similar to Jordanians by Divorced or Separated
In terms of divorced or separated, the demographic groups most similar to Jordanians are Immigrants from North Macedonia (11.5%, a difference of 0.0%), Paraguayan (11.5%, a difference of 0.060%), Taiwanese (11.5%, a difference of 0.060%), Immigrants from Northern Africa (11.5%, a difference of 0.14%), and Immigrants from Eastern Europe (11.5%, a difference of 0.16%).
| Demographics | Rating | Rank | Divorced or Separated |
| Immigrants | South Eastern Asia | 99.8 /100 | #65 | Exceptional 11.4% |
| Inupiat | 99.8 /100 | #66 | Exceptional 11.4% |
| Immigrants | Syria | 99.7 /100 | #67 | Exceptional 11.4% |
| Palestinians | 99.7 /100 | #68 | Exceptional 11.5% |
| Immigrants | Belgium | 99.7 /100 | #69 | Exceptional 11.5% |
| Immigrants | Eastern Europe | 99.7 /100 | #70 | Exceptional 11.5% |
| Paraguayans | 99.7 /100 | #71 | Exceptional 11.5% |
| Jordanians | 99.6 /100 | #72 | Exceptional 11.5% |
| Immigrants | North Macedonia | 99.6 /100 | #73 | Exceptional 11.5% |
| Taiwanese | 99.6 /100 | #74 | Exceptional 11.5% |
| Immigrants | Northern Africa | 99.6 /100 | #75 | Exceptional 11.5% |
| Albanians | 99.6 /100 | #76 | Exceptional 11.5% |
| Immigrants | Italy | 99.5 /100 | #77 | Exceptional 11.5% |
| Afghans | 99.4 /100 | #78 | Exceptional 11.5% |
| Guyanese | 99.4 /100 | #79 | Exceptional 11.5% |