Immigrants from Congo vs Hawaiian 2nd Grade
COMPARE
Immigrants from Congo
Hawaiian
2nd Grade
2nd Grade Comparison
Immigrants from Congo
Hawaiians
97.5%
2ND GRADE
0.6/ 100
METRIC RATING
255th/ 347
METRIC RANK
97.8%
2ND GRADE
28.5/ 100
METRIC RATING
193rd/ 347
METRIC RANK
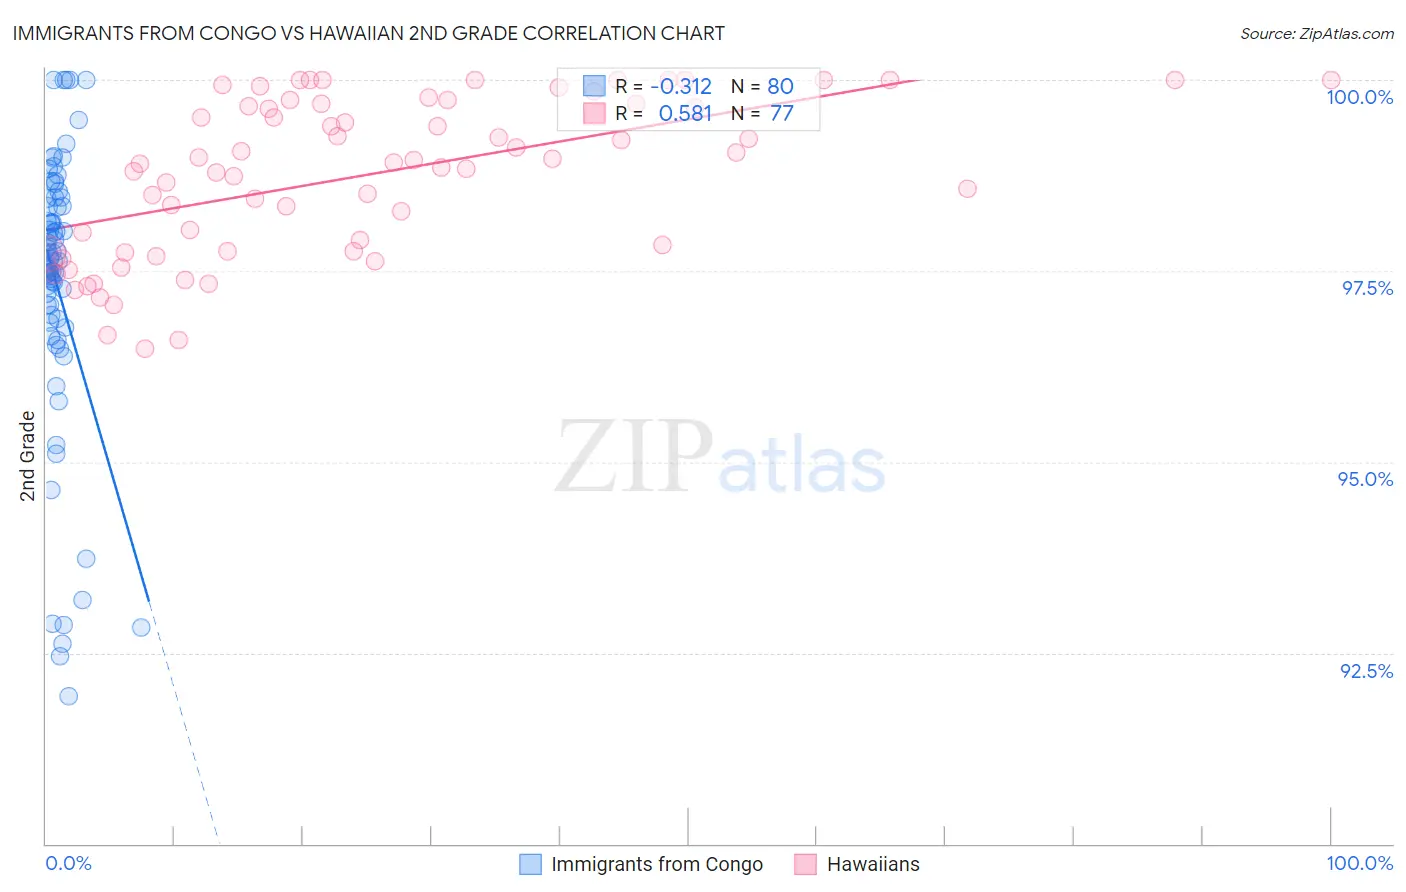
Immigrants from Congo vs Hawaiian 2nd Grade Correlation Chart
The statistical analysis conducted on geographies consisting of 92,124,753 people shows a mild negative correlation between the proportion of Immigrants from Congo and percentage of population with at least 2nd grade education in the United States with a correlation coefficient (R) of -0.312 and weighted average of 97.5%. Similarly, the statistical analysis conducted on geographies consisting of 327,621,279 people shows a substantial positive correlation between the proportion of Hawaiians and percentage of population with at least 2nd grade education in the United States with a correlation coefficient (R) of 0.581 and weighted average of 97.8%, a difference of 0.33%.
2nd Grade Correlation Summary
| Measurement | Immigrants from Congo | Hawaiian |
| Minimum | 91.9% | 96.5% |
| Maximum | 100.0% | 100.0% |
| Range | 8.1% | 3.5% |
| Mean | 97.3% | 98.8% |
| Median | 97.6% | 98.9% |
| Interquartile 25% (IQ1) | 96.8% | 97.8% |
| Interquartile 75% (IQ3) | 98.4% | 99.7% |
| Interquartile Range (IQR) | 1.5% | 1.9% |
| Standard Deviation (Sample) | 1.8% | 1.0% |
| Standard Deviation (Population) | 1.8% | 1.0% |
Similar Demographics by 2nd Grade
Demographics Similar to Immigrants from Congo by 2nd Grade
In terms of 2nd grade, the demographic groups most similar to Immigrants from Congo are Indian (Asian) (97.5%, a difference of 0.0%), Jamaican (97.5%, a difference of 0.0%), Puerto Rican (97.5%, a difference of 0.010%), Immigrants from Colombia (97.5%, a difference of 0.010%), and Yaqui (97.5%, a difference of 0.010%).
| Demographics | Rating | Rank | 2nd Grade |
| Immigrants | Middle Africa | 0.9 /100 | #248 | Tragic 97.5% |
| Bolivians | 0.9 /100 | #249 | Tragic 97.5% |
| Peruvians | 0.9 /100 | #250 | Tragic 97.5% |
| Immigrants | Africa | 0.8 /100 | #251 | Tragic 97.5% |
| Immigrants | Asia | 0.7 /100 | #252 | Tragic 97.5% |
| Puerto Ricans | 0.7 /100 | #253 | Tragic 97.5% |
| Indians (Asian) | 0.6 /100 | #254 | Tragic 97.5% |
| Immigrants | Congo | 0.6 /100 | #255 | Tragic 97.5% |
| Jamaicans | 0.6 /100 | #256 | Tragic 97.5% |
| Immigrants | Colombia | 0.5 /100 | #257 | Tragic 97.5% |
| Yaqui | 0.5 /100 | #258 | Tragic 97.5% |
| Fijians | 0.5 /100 | #259 | Tragic 97.5% |
| Assyrians/Chaldeans/Syriacs | 0.5 /100 | #260 | Tragic 97.5% |
| Armenians | 0.5 /100 | #261 | Tragic 97.5% |
| Taiwanese | 0.4 /100 | #262 | Tragic 97.4% |
Demographics Similar to Hawaiians by 2nd Grade
In terms of 2nd grade, the demographic groups most similar to Hawaiians are Immigrants from Taiwan (97.8%, a difference of 0.010%), Paraguayan (97.8%, a difference of 0.010%), Black/African American (97.8%, a difference of 0.010%), Paiute (97.8%, a difference of 0.010%), and Mongolian (97.8%, a difference of 0.010%).
| Demographics | Rating | Rank | 2nd Grade |
| Arabs | 36.9 /100 | #186 | Fair 97.8% |
| Pakistanis | 36.1 /100 | #187 | Fair 97.8% |
| Immigrants | Kazakhstan | 35.6 /100 | #188 | Fair 97.8% |
| Panamanians | 33.5 /100 | #189 | Fair 97.8% |
| Immigrants | Taiwan | 31.8 /100 | #190 | Fair 97.8% |
| Paraguayans | 30.8 /100 | #191 | Fair 97.8% |
| Blacks/African Americans | 29.9 /100 | #192 | Fair 97.8% |
| Hawaiians | 28.5 /100 | #193 | Fair 97.8% |
| Paiute | 27.0 /100 | #194 | Fair 97.8% |
| Mongolians | 26.7 /100 | #195 | Fair 97.8% |
| Immigrants | Kenya | 26.4 /100 | #196 | Fair 97.8% |
| Immigrants | Uganda | 26.3 /100 | #197 | Fair 97.8% |
| Guamanians/Chamorros | 25.7 /100 | #198 | Fair 97.8% |
| Immigrants | Egypt | 24.4 /100 | #199 | Fair 97.8% |
| Immigrants | Lebanon | 20.9 /100 | #200 | Fair 97.8% |