Immigrants from Latin America vs Jordanian 2nd Grade
COMPARE
Immigrants from Latin America
Jordanian
2nd Grade
2nd Grade Comparison
Immigrants from Latin America
Jordanians
96.5%
2ND GRADE
0.0/ 100
METRIC RATING
330th/ 347
METRIC RANK
98.0%
2ND GRADE
74.5/ 100
METRIC RATING
148th/ 347
METRIC RANK
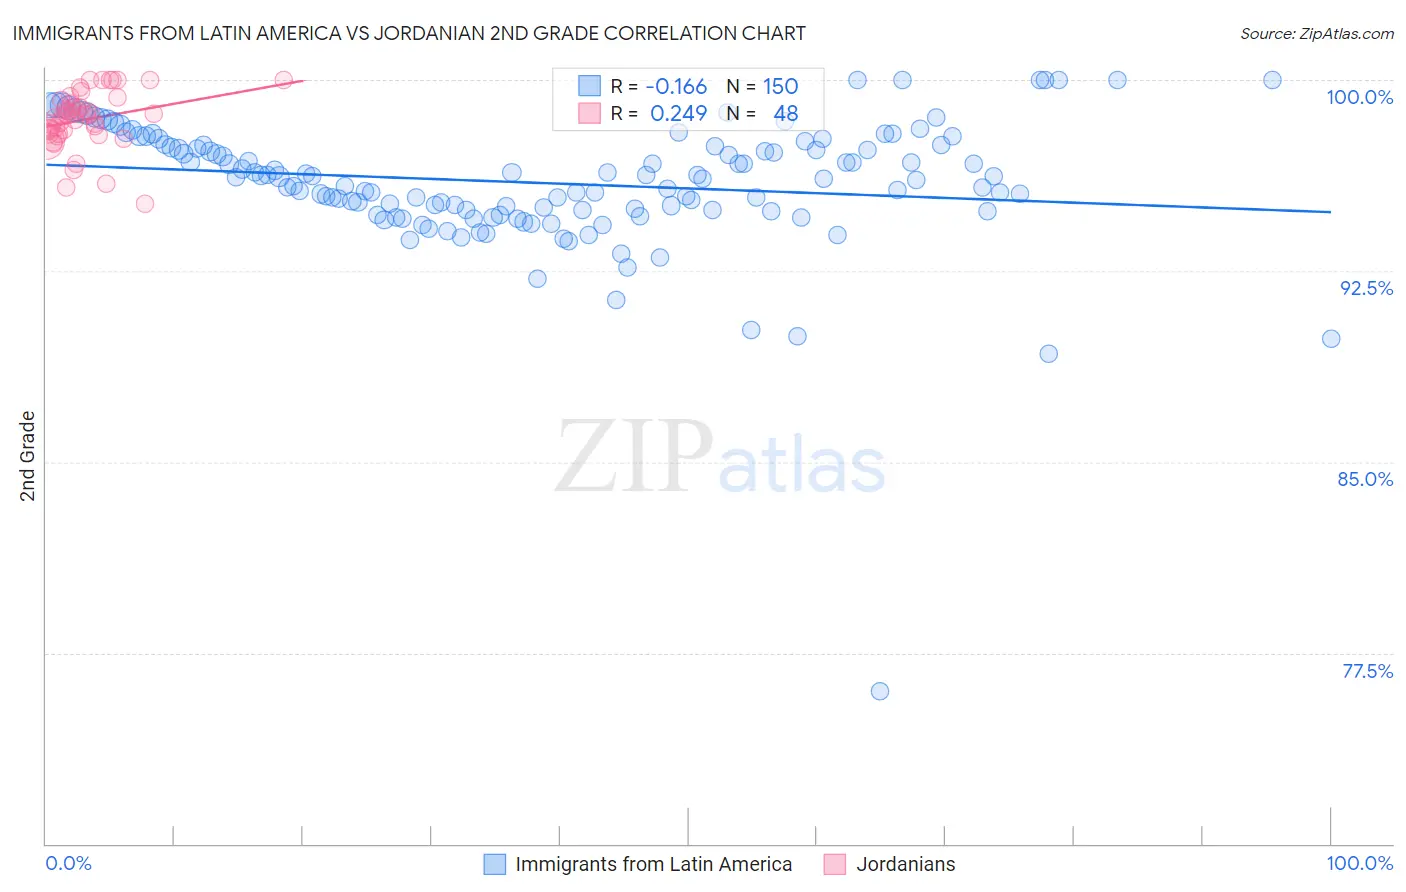
Immigrants from Latin America vs Jordanian 2nd Grade Correlation Chart
The statistical analysis conducted on geographies consisting of 558,651,896 people shows a poor negative correlation between the proportion of Immigrants from Latin America and percentage of population with at least 2nd grade education in the United States with a correlation coefficient (R) of -0.166 and weighted average of 96.5%. Similarly, the statistical analysis conducted on geographies consisting of 166,423,717 people shows a weak positive correlation between the proportion of Jordanians and percentage of population with at least 2nd grade education in the United States with a correlation coefficient (R) of 0.249 and weighted average of 98.0%, a difference of 1.5%.
2nd Grade Correlation Summary
| Measurement | Immigrants from Latin America | Jordanian |
| Minimum | 76.0% | 95.2% |
| Maximum | 100.0% | 100.0% |
| Range | 24.0% | 4.8% |
| Mean | 96.0% | 98.4% |
| Median | 96.2% | 98.6% |
| Interquartile 25% (IQ1) | 94.9% | 97.9% |
| Interquartile 75% (IQ3) | 97.4% | 99.1% |
| Interquartile Range (IQR) | 2.6% | 1.3% |
| Standard Deviation (Sample) | 2.6% | 1.1% |
| Standard Deviation (Population) | 2.6% | 1.1% |
Similar Demographics by 2nd Grade
Demographics Similar to Immigrants from Latin America by 2nd Grade
In terms of 2nd grade, the demographic groups most similar to Immigrants from Latin America are Immigrants from Vietnam (96.5%, a difference of 0.010%), Mexican (96.5%, a difference of 0.010%), Japanese (96.5%, a difference of 0.010%), Immigrants from Armenia (96.5%, a difference of 0.040%), and Bangladeshi (96.5%, a difference of 0.050%).
| Demographics | Rating | Rank | 2nd Grade |
| Vietnamese | 0.0 /100 | #323 | Tragic 96.7% |
| Mexican American Indians | 0.0 /100 | #324 | Tragic 96.7% |
| Dominicans | 0.0 /100 | #325 | Tragic 96.6% |
| Immigrants | Honduras | 0.0 /100 | #326 | Tragic 96.6% |
| Immigrants | Vietnam | 0.0 /100 | #327 | Tragic 96.5% |
| Mexicans | 0.0 /100 | #328 | Tragic 96.5% |
| Japanese | 0.0 /100 | #329 | Tragic 96.5% |
| Immigrants | Latin America | 0.0 /100 | #330 | Tragic 96.5% |
| Immigrants | Armenia | 0.0 /100 | #331 | Tragic 96.5% |
| Bangladeshis | 0.0 /100 | #332 | Tragic 96.5% |
| Immigrants | Dominican Republic | 0.0 /100 | #333 | Tragic 96.4% |
| Central Americans | 0.0 /100 | #334 | Tragic 96.4% |
| Yakama | 0.0 /100 | #335 | Tragic 96.4% |
| Immigrants | Fiji | 0.0 /100 | #336 | Tragic 96.4% |
| Immigrants | Cambodia | 0.0 /100 | #337 | Tragic 96.4% |
Demographics Similar to Jordanians by 2nd Grade
In terms of 2nd grade, the demographic groups most similar to Jordanians are Apache (97.9%, a difference of 0.0%), Immigrants from Greece (98.0%, a difference of 0.010%), Immigrants from Moldova (97.9%, a difference of 0.010%), Hmong (98.0%, a difference of 0.020%), and Filipino (98.0%, a difference of 0.020%).
| Demographics | Rating | Rank | 2nd Grade |
| Immigrants | Turkey | 83.0 /100 | #141 | Excellent 98.0% |
| Burmese | 81.0 /100 | #142 | Excellent 98.0% |
| Alsatians | 80.5 /100 | #143 | Excellent 98.0% |
| Hmong | 80.0 /100 | #144 | Good 98.0% |
| Filipinos | 79.2 /100 | #145 | Good 98.0% |
| Immigrants | Israel | 78.0 /100 | #146 | Good 98.0% |
| Immigrants | Greece | 76.8 /100 | #147 | Good 98.0% |
| Jordanians | 74.5 /100 | #148 | Good 98.0% |
| Apache | 74.0 /100 | #149 | Good 97.9% |
| Immigrants | Moldova | 72.9 /100 | #150 | Good 97.9% |
| Soviet Union | 70.7 /100 | #151 | Good 97.9% |
| Immigrants | North Macedonia | 68.5 /100 | #152 | Good 97.9% |
| Immigrants | South Central Asia | 68.3 /100 | #153 | Good 97.9% |
| Marshallese | 67.7 /100 | #154 | Good 97.9% |
| French American Indians | 64.3 /100 | #155 | Good 97.9% |