Immigrants from Colombia vs Luxembourger Professional Degree
COMPARE
Immigrants from Colombia
Luxembourger
Professional Degree
Professional Degree Comparison
Immigrants from Colombia
Luxembourgers
4.5%
PROFESSIONAL DEGREE
59.4/ 100
METRIC RATING
166th/ 347
METRIC RANK
4.6%
PROFESSIONAL DEGREE
78.7/ 100
METRIC RATING
146th/ 347
METRIC RANK
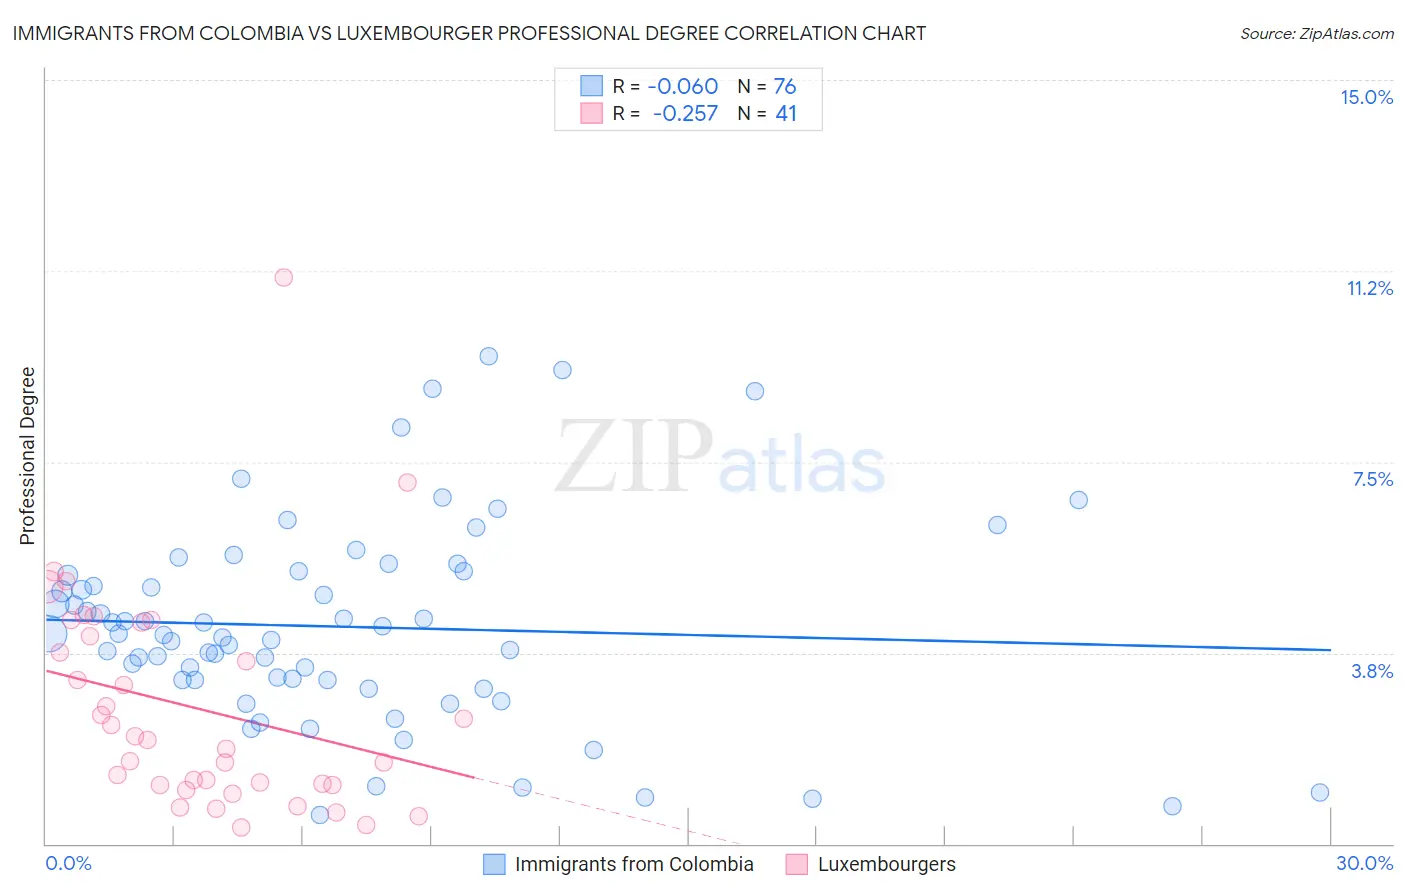
Immigrants from Colombia vs Luxembourger Professional Degree Correlation Chart
The statistical analysis conducted on geographies consisting of 378,013,627 people shows a slight negative correlation between the proportion of Immigrants from Colombia and percentage of population with at least professional degree education in the United States with a correlation coefficient (R) of -0.060 and weighted average of 4.5%. Similarly, the statistical analysis conducted on geographies consisting of 144,524,005 people shows a weak negative correlation between the proportion of Luxembourgers and percentage of population with at least professional degree education in the United States with a correlation coefficient (R) of -0.257 and weighted average of 4.6%, a difference of 3.3%.
Professional Degree Correlation Summary
| Measurement | Immigrants from Colombia | Luxembourger |
| Minimum | 0.57% | 0.31% |
| Maximum | 9.6% | 11.1% |
| Range | 9.0% | 10.8% |
| Mean | 4.3% | 2.7% |
| Median | 4.1% | 2.0% |
| Interquartile 25% (IQ1) | 3.2% | 1.2% |
| Interquartile 75% (IQ3) | 5.3% | 4.2% |
| Interquartile Range (IQR) | 2.1% | 3.1% |
| Standard Deviation (Sample) | 2.0% | 2.2% |
| Standard Deviation (Population) | 2.0% | 2.1% |
Demographics Similar to Immigrants from Colombia and Luxembourgers by Professional Degree
In terms of professional degree, the demographic groups most similar to Immigrants from Colombia are Costa Rican (4.5%, a difference of 0.080%), Swiss (4.5%, a difference of 0.24%), Sierra Leonean (4.5%, a difference of 0.75%), Peruvian (4.5%, a difference of 0.89%), and Assyrian/Chaldean/Syriac (4.5%, a difference of 1.2%). Similarly, the demographic groups most similar to Luxembourgers are Colombian (4.6%, a difference of 0.21%), Slovene (4.6%, a difference of 0.53%), Senegalese (4.6%, a difference of 0.68%), Immigrants from Oceania (4.6%, a difference of 1.0%), and Polish (4.6%, a difference of 1.2%).
| Demographics | Rating | Rank | Professional Degree |
| Luxembourgers | 78.7 /100 | #146 | Good 4.6% |
| Colombians | 77.7 /100 | #147 | Good 4.6% |
| Slovenes | 76.1 /100 | #148 | Good 4.6% |
| Senegalese | 75.3 /100 | #149 | Good 4.6% |
| Immigrants | Oceania | 73.4 /100 | #150 | Good 4.6% |
| Poles | 72.6 /100 | #151 | Good 4.6% |
| Immigrants | Africa | 72.5 /100 | #152 | Good 4.6% |
| Immigrants | Uruguay | 72.5 /100 | #153 | Good 4.6% |
| Scottish | 71.8 /100 | #154 | Good 4.6% |
| Slavs | 70.8 /100 | #155 | Good 4.5% |
| Swedes | 69.9 /100 | #156 | Good 4.5% |
| Iraqis | 69.8 /100 | #157 | Good 4.5% |
| Immigrants | Armenia | 68.8 /100 | #158 | Good 4.5% |
| Vietnamese | 68.4 /100 | #159 | Good 4.5% |
| Immigrants | Senegal | 68.0 /100 | #160 | Good 4.5% |
| Assyrians/Chaldeans/Syriacs | 67.4 /100 | #161 | Good 4.5% |
| Peruvians | 65.2 /100 | #162 | Good 4.5% |
| Sierra Leoneans | 64.3 /100 | #163 | Good 4.5% |
| Swiss | 61.0 /100 | #164 | Good 4.5% |
| Costa Ricans | 59.9 /100 | #165 | Average 4.5% |
| Immigrants | Colombia | 59.4 /100 | #166 | Average 4.5% |