Immigrants from Colombia vs Aleut 11th Grade
COMPARE
Immigrants from Colombia
Aleut
11th Grade
11th Grade Comparison
Immigrants from Colombia
Aleuts
91.4%
11TH GRADE
0.6/ 100
METRIC RATING
258th/ 347
METRIC RANK
93.7%
11TH GRADE
99.5/ 100
METRIC RATING
77th/ 347
METRIC RANK
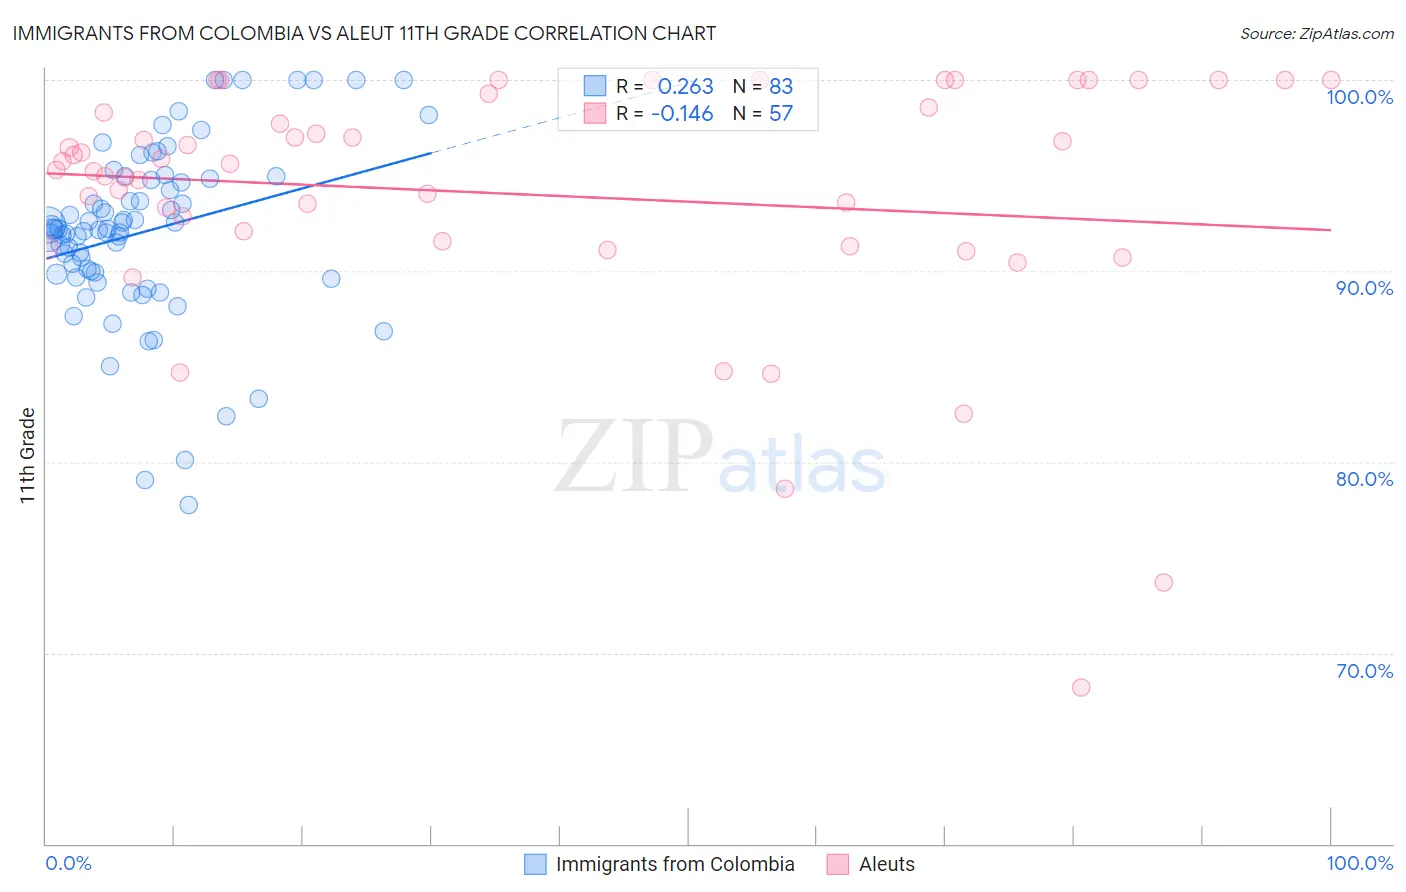
Immigrants from Colombia vs Aleut 11th Grade Correlation Chart
The statistical analysis conducted on geographies consisting of 378,643,826 people shows a weak positive correlation between the proportion of Immigrants from Colombia and percentage of population with at least 11th grade education in the United States with a correlation coefficient (R) of 0.263 and weighted average of 91.4%. Similarly, the statistical analysis conducted on geographies consisting of 61,782,880 people shows a poor negative correlation between the proportion of Aleuts and percentage of population with at least 11th grade education in the United States with a correlation coefficient (R) of -0.146 and weighted average of 93.7%, a difference of 2.6%.
11th Grade Correlation Summary
| Measurement | Immigrants from Colombia | Aleut |
| Minimum | 77.8% | 68.2% |
| Maximum | 100.0% | 100.0% |
| Range | 22.2% | 31.8% |
| Mean | 92.1% | 94.0% |
| Median | 92.2% | 95.6% |
| Interquartile 25% (IQ1) | 89.8% | 91.4% |
| Interquartile 75% (IQ3) | 94.8% | 98.9% |
| Interquartile Range (IQR) | 5.0% | 7.5% |
| Standard Deviation (Sample) | 4.6% | 6.6% |
| Standard Deviation (Population) | 4.6% | 6.5% |
Similar Demographics by 11th Grade
Demographics Similar to Immigrants from Colombia by 11th Grade
In terms of 11th grade, the demographic groups most similar to Immigrants from Colombia are Jamaican (91.4%, a difference of 0.010%), Cajun (91.4%, a difference of 0.020%), Spanish American (91.4%, a difference of 0.020%), Black/African American (91.4%, a difference of 0.030%), and Immigrants from Senegal (91.4%, a difference of 0.030%).
| Demographics | Rating | Rank | 11th Grade |
| Immigrants | Costa Rica | 0.9 /100 | #251 | Tragic 91.4% |
| Immigrants | Nigeria | 0.8 /100 | #252 | Tragic 91.4% |
| Immigrants | South America | 0.8 /100 | #253 | Tragic 91.4% |
| Immigrants | Eritrea | 0.7 /100 | #254 | Tragic 91.4% |
| Blacks/African Americans | 0.7 /100 | #255 | Tragic 91.4% |
| Immigrants | Senegal | 0.7 /100 | #256 | Tragic 91.4% |
| Cajuns | 0.7 /100 | #257 | Tragic 91.4% |
| Immigrants | Colombia | 0.6 /100 | #258 | Tragic 91.4% |
| Jamaicans | 0.6 /100 | #259 | Tragic 91.4% |
| Spanish Americans | 0.6 /100 | #260 | Tragic 91.4% |
| Taiwanese | 0.6 /100 | #261 | Tragic 91.3% |
| Immigrants | Uruguay | 0.5 /100 | #262 | Tragic 91.3% |
| Immigrants | Ghana | 0.3 /100 | #263 | Tragic 91.2% |
| Yup'ik | 0.3 /100 | #264 | Tragic 91.2% |
| Pueblo | 0.3 /100 | #265 | Tragic 91.2% |
Demographics Similar to Aleuts by 11th Grade
In terms of 11th grade, the demographic groups most similar to Aleuts are Celtic (93.7%, a difference of 0.0%), Soviet Union (93.7%, a difference of 0.0%), Immigrants from Denmark (93.7%, a difference of 0.010%), Immigrants from Latvia (93.8%, a difference of 0.030%), and Canadian (93.7%, a difference of 0.030%).
| Demographics | Rating | Rank | 11th Grade |
| Immigrants | England | 99.7 /100 | #70 | Exceptional 93.8% |
| Immigrants | South Africa | 99.7 /100 | #71 | Exceptional 93.8% |
| Immigrants | Japan | 99.7 /100 | #72 | Exceptional 93.8% |
| Romanians | 99.6 /100 | #73 | Exceptional 93.8% |
| Immigrants | Czechoslovakia | 99.6 /100 | #74 | Exceptional 93.8% |
| Immigrants | Latvia | 99.6 /100 | #75 | Exceptional 93.8% |
| Celtics | 99.5 /100 | #76 | Exceptional 93.7% |
| Aleuts | 99.5 /100 | #77 | Exceptional 93.7% |
| Soviet Union | 99.5 /100 | #78 | Exceptional 93.7% |
| Immigrants | Denmark | 99.5 /100 | #79 | Exceptional 93.7% |
| Canadians | 99.5 /100 | #80 | Exceptional 93.7% |
| Immigrants | Moldova | 99.5 /100 | #81 | Exceptional 93.7% |
| Immigrants | Saudi Arabia | 99.3 /100 | #82 | Exceptional 93.7% |
| Icelanders | 99.3 /100 | #83 | Exceptional 93.6% |
| Immigrants | Taiwan | 99.3 /100 | #84 | Exceptional 93.6% |