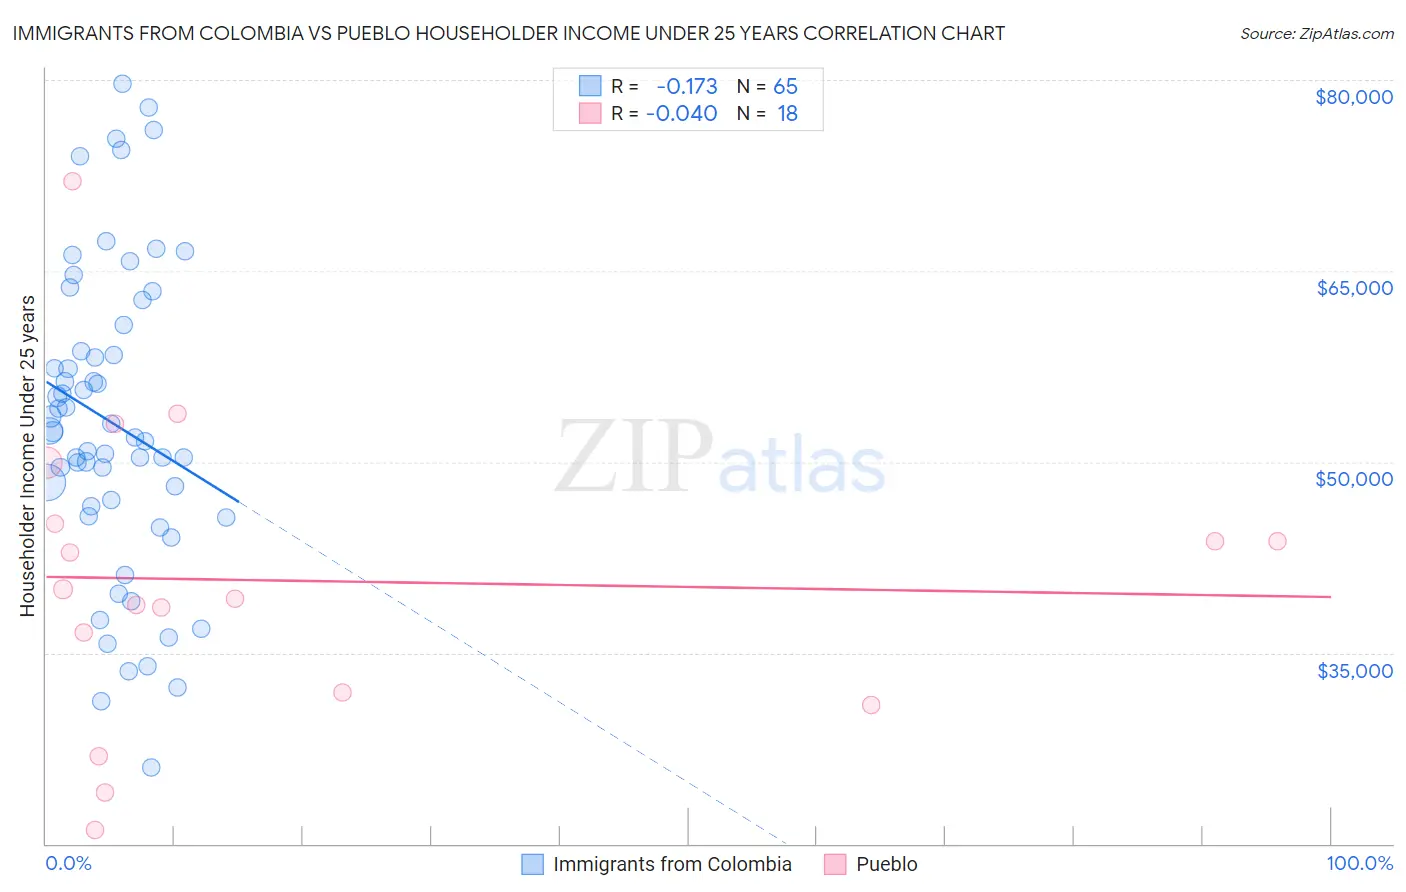
Immigrants from Colombia vs Pueblo Householder Income Under 25 years
COMPARE
Immigrants from Colombia
Pueblo
Householder Income Under 25 years
Householder Income Under 25 years Comparison
Immigrants from Colombia
Pueblo
$53,714
HOUSEHOLDER INCOME UNDER 25 YEARS
97.7/ 100
METRIC RATING
111th/ 347
METRIC RANK
$45,018
HOUSEHOLDER INCOME UNDER 25 YEARS
0.0/ 100
METRIC RATING
337th/ 347
METRIC RANK
Immigrants from Colombia vs Pueblo Householder Income Under 25 years Correlation Chart
The statistical analysis conducted on geographies consisting of 319,710,723 people shows a poor negative correlation between the proportion of Immigrants from Colombia and household income with householder under the age of 25 in the United States with a correlation coefficient (R) of -0.173 and weighted average of $53,714. Similarly, the statistical analysis conducted on geographies consisting of 113,072,250 people shows no correlation between the proportion of Pueblo and household income with householder under the age of 25 in the United States with a correlation coefficient (R) of -0.040 and weighted average of $45,018, a difference of 19.3%.
Householder Income Under 25 years Correlation Summary
| Measurement | Immigrants from Colombia | Pueblo |
| Minimum | $26,011 | $21,071 |
| Maximum | $79,746 | $72,000 |
| Range | $53,735 | $50,929 |
| Mean | $53,063 | $40,668 |
| Median | $52,383 | $39,611 |
| Interquartile 25% (IQ1) | $46,106 | $31,875 |
| Interquartile 75% (IQ3) | $59,736 | $45,115 |
| Interquartile Range (IQR) | $13,629 | $13,240 |
| Standard Deviation (Sample) | $12,053 | $12,094 |
| Standard Deviation (Population) | $11,960 | $11,753 |
Similar Demographics by Householder Income Under 25 years
Demographics Similar to Immigrants from Colombia by Householder Income Under 25 years
In terms of householder income under 25 years, the demographic groups most similar to Immigrants from Colombia are Greek ($53,715, a difference of 0.0%), Immigrants from Ecuador ($53,722, a difference of 0.010%), Maltese ($53,735, a difference of 0.040%), Australian ($53,739, a difference of 0.050%), and Immigrants from Oceania ($53,680, a difference of 0.060%).
| Demographics | Rating | Rank | Householder Income Under 25 years |
| Ethiopians | 98.2 /100 | #104 | Exceptional $53,818 |
| Immigrants | France | 98.1 /100 | #105 | Exceptional $53,805 |
| Albanians | 98.1 /100 | #106 | Exceptional $53,794 |
| Australians | 97.8 /100 | #107 | Exceptional $53,739 |
| Maltese | 97.8 /100 | #108 | Exceptional $53,735 |
| Immigrants | Ecuador | 97.7 /100 | #109 | Exceptional $53,722 |
| Greeks | 97.7 /100 | #110 | Exceptional $53,715 |
| Immigrants | Colombia | 97.7 /100 | #111 | Exceptional $53,714 |
| Immigrants | Oceania | 97.5 /100 | #112 | Exceptional $53,680 |
| Romanians | 97.2 /100 | #113 | Exceptional $53,632 |
| Immigrants | Sweden | 97.1 /100 | #114 | Exceptional $53,621 |
| Immigrants | Albania | 96.9 /100 | #115 | Exceptional $53,597 |
| Immigrants | Spain | 96.6 /100 | #116 | Exceptional $53,560 |
| Lithuanians | 96.6 /100 | #117 | Exceptional $53,552 |
| Immigrants | Switzerland | 96.3 /100 | #118 | Exceptional $53,528 |
Demographics Similar to Pueblo by Householder Income Under 25 years
In terms of householder income under 25 years, the demographic groups most similar to Pueblo are Tohono O'odham ($45,248, a difference of 0.51%), Cheyenne ($45,275, a difference of 0.57%), Chickasaw ($44,763, a difference of 0.57%), Kiowa ($44,733, a difference of 0.64%), and Cajun ($45,338, a difference of 0.71%).
| Demographics | Rating | Rank | Householder Income Under 25 years |
| Indonesians | 0.0 /100 | #330 | Tragic $45,566 |
| Immigrants | Zaire | 0.0 /100 | #331 | Tragic $45,529 |
| Choctaw | 0.0 /100 | #332 | Tragic $45,450 |
| Creek | 0.0 /100 | #333 | Tragic $45,371 |
| Cajuns | 0.0 /100 | #334 | Tragic $45,338 |
| Cheyenne | 0.0 /100 | #335 | Tragic $45,275 |
| Tohono O'odham | 0.0 /100 | #336 | Tragic $45,248 |
| Pueblo | 0.0 /100 | #337 | Tragic $45,018 |
| Chickasaw | 0.0 /100 | #338 | Tragic $44,763 |
| Kiowa | 0.0 /100 | #339 | Tragic $44,733 |
| Blacks/African Americans | 0.0 /100 | #340 | Tragic $44,381 |
| Houma | 0.0 /100 | #341 | Tragic $44,356 |
| Arapaho | 0.0 /100 | #342 | Tragic $44,003 |
| Immigrants | Yemen | 0.0 /100 | #343 | Tragic $43,591 |
| Immigrants | Congo | 0.0 /100 | #344 | Tragic $43,266 |