Immigrants from South America vs Korean 6th Grade
COMPARE
Immigrants from South America
Korean
6th Grade
6th Grade Comparison
Immigrants from South America
Koreans
96.3%
6TH GRADE
0.2/ 100
METRIC RATING
270th/ 347
METRIC RANK
96.6%
6TH GRADE
1.9/ 100
METRIC RATING
240th/ 347
METRIC RANK
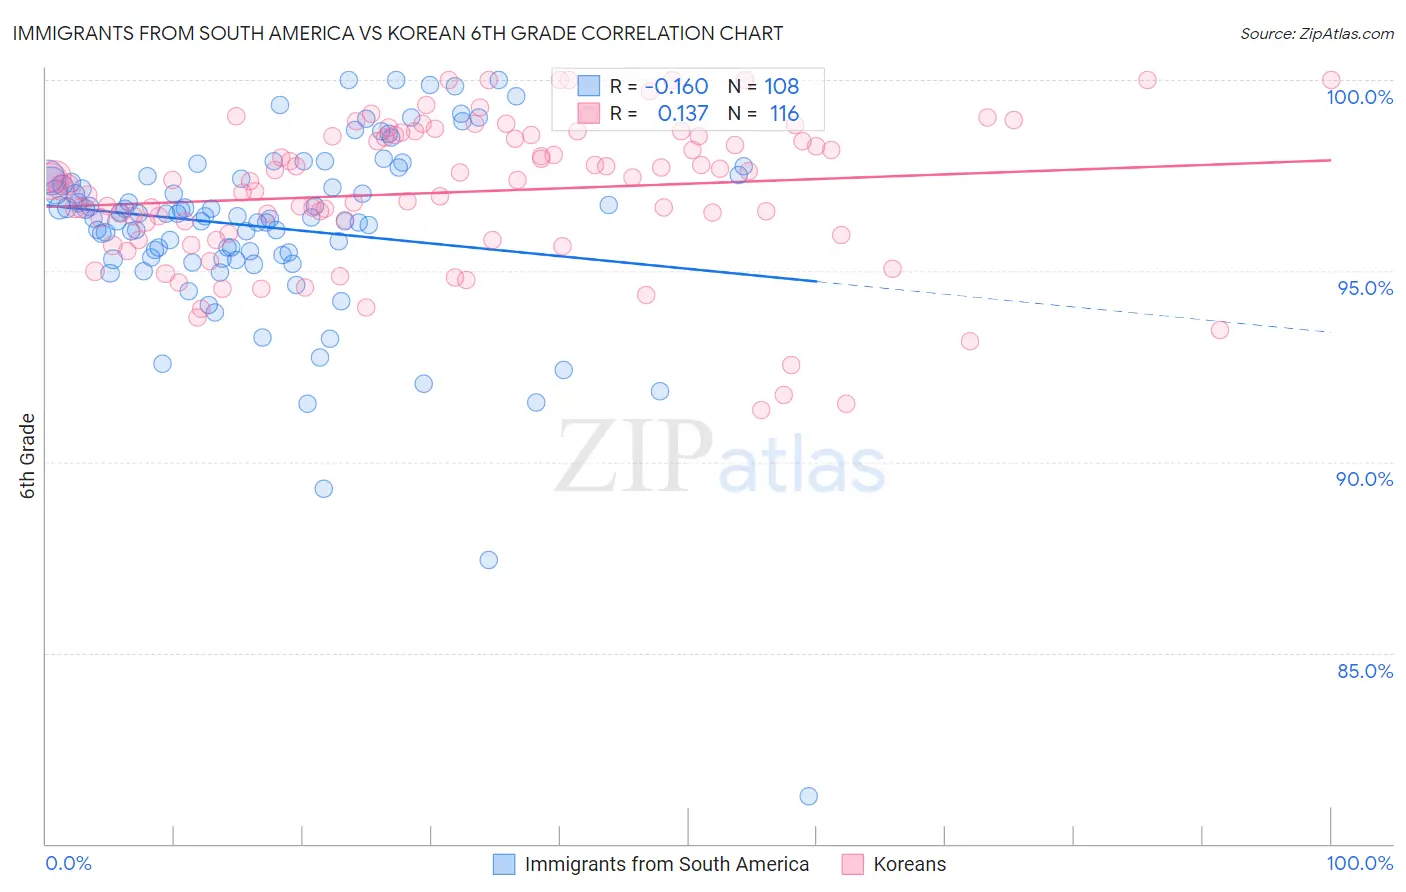
Immigrants from South America vs Korean 6th Grade Correlation Chart
The statistical analysis conducted on geographies consisting of 486,429,751 people shows a poor negative correlation between the proportion of Immigrants from South America and percentage of population with at least 6th grade education in the United States with a correlation coefficient (R) of -0.160 and weighted average of 96.3%. Similarly, the statistical analysis conducted on geographies consisting of 510,946,939 people shows a poor positive correlation between the proportion of Koreans and percentage of population with at least 6th grade education in the United States with a correlation coefficient (R) of 0.137 and weighted average of 96.6%, a difference of 0.28%.
6th Grade Correlation Summary
| Measurement | Immigrants from South America | Korean |
| Minimum | 81.2% | 91.4% |
| Maximum | 100.0% | 100.0% |
| Range | 18.8% | 8.6% |
| Mean | 96.1% | 97.1% |
| Median | 96.4% | 97.3% |
| Interquartile 25% (IQ1) | 95.4% | 95.9% |
| Interquartile 75% (IQ3) | 97.4% | 98.5% |
| Interquartile Range (IQR) | 2.1% | 2.6% |
| Standard Deviation (Sample) | 2.6% | 1.9% |
| Standard Deviation (Population) | 2.6% | 1.9% |
Similar Demographics by 6th Grade
Demographics Similar to Immigrants from South America by 6th Grade
In terms of 6th grade, the demographic groups most similar to Immigrants from South America are West Indian (96.3%, a difference of 0.0%), Immigrants from Uzbekistan (96.3%, a difference of 0.010%), Immigrants from Hong Kong (96.3%, a difference of 0.010%), Afghan (96.4%, a difference of 0.030%), and Immigrants from Jamaica (96.4%, a difference of 0.040%).
| Demographics | Rating | Rank | 6th Grade |
| Immigrants | Colombia | 0.3 /100 | #263 | Tragic 96.4% |
| Armenians | 0.3 /100 | #264 | Tragic 96.4% |
| Immigrants | Jamaica | 0.2 /100 | #265 | Tragic 96.4% |
| Ghanaians | 0.2 /100 | #266 | Tragic 96.4% |
| Afghans | 0.2 /100 | #267 | Tragic 96.4% |
| Immigrants | Uzbekistan | 0.2 /100 | #268 | Tragic 96.3% |
| West Indians | 0.2 /100 | #269 | Tragic 96.3% |
| Immigrants | South America | 0.2 /100 | #270 | Tragic 96.3% |
| Immigrants | Hong Kong | 0.2 /100 | #271 | Tragic 96.3% |
| Immigrants | Bolivia | 0.1 /100 | #272 | Tragic 96.3% |
| Immigrants | Cameroon | 0.1 /100 | #273 | Tragic 96.3% |
| Immigrants | Philippines | 0.1 /100 | #274 | Tragic 96.3% |
| Immigrants | Ghana | 0.1 /100 | #275 | Tragic 96.3% |
| Yaqui | 0.1 /100 | #276 | Tragic 96.3% |
| Immigrants | Western Africa | 0.1 /100 | #277 | Tragic 96.3% |
Demographics Similar to Koreans by 6th Grade
In terms of 6th grade, the demographic groups most similar to Koreans are Nigerian (96.6%, a difference of 0.0%), Indian (Asian) (96.6%, a difference of 0.0%), Senegalese (96.6%, a difference of 0.0%), Immigrants from Eastern Africa (96.6%, a difference of 0.010%), and Immigrants from Asia (96.6%, a difference of 0.010%).
| Demographics | Rating | Rank | 6th Grade |
| Yuman | 3.2 /100 | #233 | Tragic 96.7% |
| Uruguayans | 2.5 /100 | #234 | Tragic 96.6% |
| Asians | 2.4 /100 | #235 | Tragic 96.6% |
| Immigrants | Indonesia | 2.3 /100 | #236 | Tragic 96.6% |
| Immigrants | Eastern Africa | 2.0 /100 | #237 | Tragic 96.6% |
| Nigerians | 1.9 /100 | #238 | Tragic 96.6% |
| Indians (Asian) | 1.9 /100 | #239 | Tragic 96.6% |
| Koreans | 1.9 /100 | #240 | Tragic 96.6% |
| Senegalese | 1.8 /100 | #241 | Tragic 96.6% |
| Immigrants | Asia | 1.8 /100 | #242 | Tragic 96.6% |
| Immigrants | Liberia | 1.6 /100 | #243 | Tragic 96.6% |
| Ethiopians | 1.5 /100 | #244 | Tragic 96.6% |
| Immigrants | Costa Rica | 1.3 /100 | #245 | Tragic 96.6% |
| Immigrants | Africa | 1.3 /100 | #246 | Tragic 96.6% |
| Bolivians | 1.0 /100 | #247 | Tragic 96.5% |