South American Indian vs Scandinavian 3rd Grade
COMPARE
South American Indian
Scandinavian
3rd Grade
3rd Grade Comparison
South American Indians
Scandinavians
97.5%
3RD GRADE
5.7/ 100
METRIC RATING
217th/ 347
METRIC RANK
98.4%
3RD GRADE
100.0/ 100
METRIC RATING
32nd/ 347
METRIC RANK
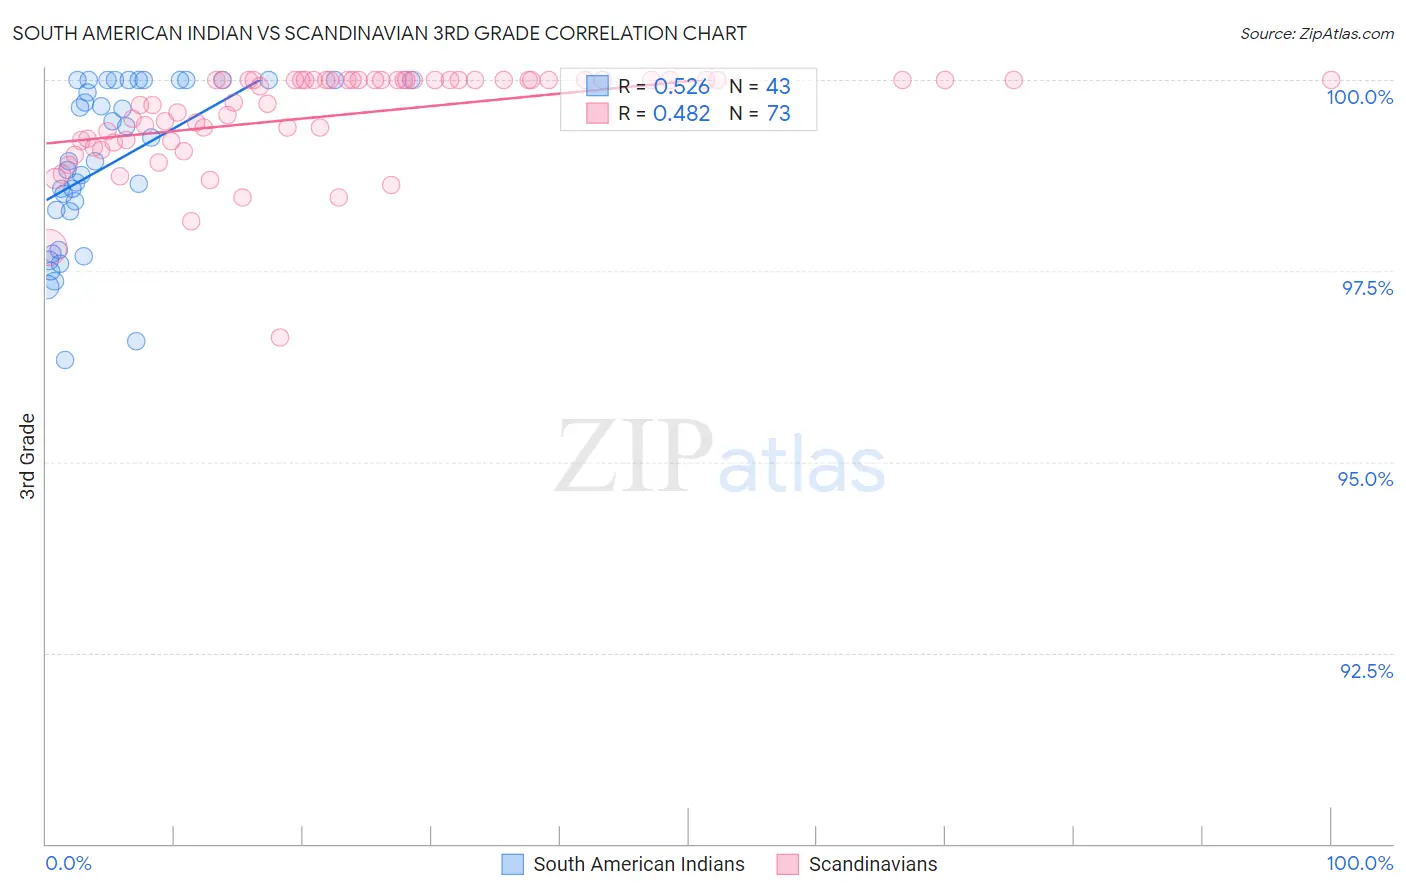
South American Indian vs Scandinavian 3rd Grade Correlation Chart
The statistical analysis conducted on geographies consisting of 164,573,401 people shows a substantial positive correlation between the proportion of South American Indians and percentage of population with at least 3rd grade education in the United States with a correlation coefficient (R) of 0.526 and weighted average of 97.5%. Similarly, the statistical analysis conducted on geographies consisting of 472,660,430 people shows a moderate positive correlation between the proportion of Scandinavians and percentage of population with at least 3rd grade education in the United States with a correlation coefficient (R) of 0.482 and weighted average of 98.4%, a difference of 0.93%.
3rd Grade Correlation Summary
| Measurement | South American Indian | Scandinavian |
| Minimum | 96.3% | 96.6% |
| Maximum | 100.0% | 100.0% |
| Range | 3.7% | 3.4% |
| Mean | 98.9% | 99.5% |
| Median | 98.9% | 100.0% |
| Interquartile 25% (IQ1) | 98.3% | 99.2% |
| Interquartile 75% (IQ3) | 100.0% | 100.0% |
| Interquartile Range (IQR) | 1.7% | 0.80% |
| Standard Deviation (Sample) | 1.1% | 0.64% |
| Standard Deviation (Population) | 1.1% | 0.64% |
Similar Demographics by 3rd Grade
Demographics Similar to South American Indians by 3rd Grade
In terms of 3rd grade, the demographic groups most similar to South American Indians are Immigrants from Nepal (97.5%, a difference of 0.010%), Immigrants from Panama (97.5%, a difference of 0.010%), Immigrants from Morocco (97.5%, a difference of 0.010%), Uruguayan (97.5%, a difference of 0.010%), and Iraqi (97.5%, a difference of 0.020%).
| Demographics | Rating | Rank | 3rd Grade |
| Immigrants | Oceania | 9.5 /100 | #210 | Tragic 97.6% |
| Laotians | 9.4 /100 | #211 | Tragic 97.6% |
| Immigrants | Bahamas | 8.5 /100 | #212 | Tragic 97.6% |
| Moroccans | 8.5 /100 | #213 | Tragic 97.6% |
| Yuman | 8.4 /100 | #214 | Tragic 97.6% |
| Iraqis | 6.9 /100 | #215 | Tragic 97.5% |
| Samoans | 6.9 /100 | #216 | Tragic 97.5% |
| South American Indians | 5.7 /100 | #217 | Tragic 97.5% |
| Immigrants | Nepal | 5.3 /100 | #218 | Tragic 97.5% |
| Immigrants | Panama | 5.2 /100 | #219 | Tragic 97.5% |
| Immigrants | Morocco | 5.0 /100 | #220 | Tragic 97.5% |
| Uruguayans | 5.0 /100 | #221 | Tragic 97.5% |
| Sierra Leoneans | 4.6 /100 | #222 | Tragic 97.5% |
| Immigrants | Syria | 4.4 /100 | #223 | Tragic 97.5% |
| Bahamians | 4.4 /100 | #224 | Tragic 97.5% |
Demographics Similar to Scandinavians by 3rd Grade
In terms of 3rd grade, the demographic groups most similar to Scandinavians are Czech (98.4%, a difference of 0.0%), French Canadian (98.4%, a difference of 0.010%), European (98.4%, a difference of 0.010%), French (98.4%, a difference of 0.020%), and Chinese (98.4%, a difference of 0.020%).
| Demographics | Rating | Rank | 3rd Grade |
| Scotch-Irish | 100.0 /100 | #25 | Exceptional 98.5% |
| Aleuts | 100.0 /100 | #26 | Exceptional 98.5% |
| Croatians | 100.0 /100 | #27 | Exceptional 98.5% |
| French | 100.0 /100 | #28 | Exceptional 98.4% |
| French Canadians | 100.0 /100 | #29 | Exceptional 98.4% |
| Europeans | 100.0 /100 | #30 | Exceptional 98.4% |
| Czechs | 100.0 /100 | #31 | Exceptional 98.4% |
| Scandinavians | 100.0 /100 | #32 | Exceptional 98.4% |
| Chinese | 100.0 /100 | #33 | Exceptional 98.4% |
| Swiss | 100.0 /100 | #34 | Exceptional 98.4% |
| Arapaho | 100.0 /100 | #35 | Exceptional 98.4% |
| British | 99.9 /100 | #36 | Exceptional 98.4% |
| Italians | 99.9 /100 | #37 | Exceptional 98.4% |
| Chippewa | 99.9 /100 | #38 | Exceptional 98.4% |
| Latvians | 99.9 /100 | #39 | Exceptional 98.4% |