Russian vs Scandinavian 3rd Grade
COMPARE
Russian
Scandinavian
3rd Grade
3rd Grade Comparison
Russians
Scandinavians
98.2%
3RD GRADE
99.6/ 100
METRIC RATING
67th/ 347
METRIC RANK
98.4%
3RD GRADE
100.0/ 100
METRIC RATING
32nd/ 347
METRIC RANK
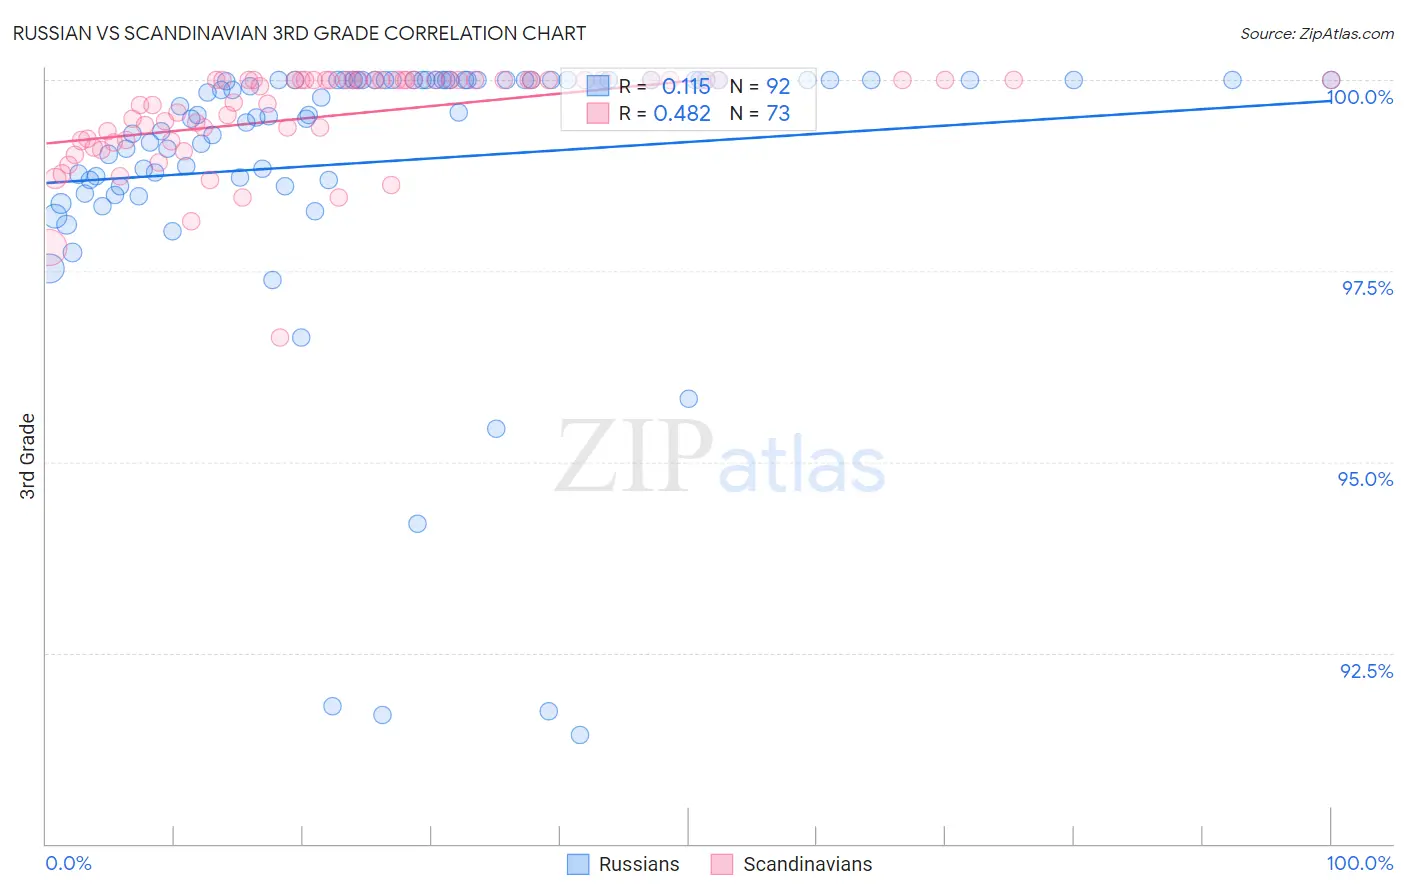
Russian vs Scandinavian 3rd Grade Correlation Chart
The statistical analysis conducted on geographies consisting of 512,259,139 people shows a poor positive correlation between the proportion of Russians and percentage of population with at least 3rd grade education in the United States with a correlation coefficient (R) of 0.115 and weighted average of 98.2%. Similarly, the statistical analysis conducted on geographies consisting of 472,660,430 people shows a moderate positive correlation between the proportion of Scandinavians and percentage of population with at least 3rd grade education in the United States with a correlation coefficient (R) of 0.482 and weighted average of 98.4%, a difference of 0.21%.
3rd Grade Correlation Summary
| Measurement | Russian | Scandinavian |
| Minimum | 91.4% | 96.6% |
| Maximum | 100.0% | 100.0% |
| Range | 8.6% | 3.4% |
| Mean | 98.9% | 99.5% |
| Median | 99.6% | 100.0% |
| Interquartile 25% (IQ1) | 98.7% | 99.2% |
| Interquartile 75% (IQ3) | 100.0% | 100.0% |
| Interquartile Range (IQR) | 1.3% | 0.80% |
| Standard Deviation (Sample) | 1.9% | 0.64% |
| Standard Deviation (Population) | 1.9% | 0.64% |
Similar Demographics by 3rd Grade
Demographics Similar to Russians by 3rd Grade
In terms of 3rd grade, the demographic groups most similar to Russians are New Zealander (98.2%, a difference of 0.0%), Serbian (98.2%, a difference of 0.0%), Immigrants from Northern Europe (98.2%, a difference of 0.0%), Canadian (98.2%, a difference of 0.0%), and Kiowa (98.2%, a difference of 0.010%).
| Demographics | Rating | Rank | 3rd Grade |
| Creek | 99.7 /100 | #60 | Exceptional 98.2% |
| Pueblo | 99.7 /100 | #61 | Exceptional 98.2% |
| Immigrants | Canada | 99.7 /100 | #62 | Exceptional 98.2% |
| Immigrants | North America | 99.7 /100 | #63 | Exceptional 98.2% |
| Kiowa | 99.6 /100 | #64 | Exceptional 98.2% |
| New Zealanders | 99.6 /100 | #65 | Exceptional 98.2% |
| Serbians | 99.6 /100 | #66 | Exceptional 98.2% |
| Russians | 99.6 /100 | #67 | Exceptional 98.2% |
| Immigrants | Northern Europe | 99.6 /100 | #68 | Exceptional 98.2% |
| Canadians | 99.6 /100 | #69 | Exceptional 98.2% |
| Cajuns | 99.6 /100 | #70 | Exceptional 98.2% |
| Immigrants | Austria | 99.6 /100 | #71 | Exceptional 98.2% |
| Chickasaw | 99.5 /100 | #72 | Exceptional 98.2% |
| Cheyenne | 99.3 /100 | #73 | Exceptional 98.2% |
| Immigrants | Netherlands | 99.3 /100 | #74 | Exceptional 98.2% |
Demographics Similar to Scandinavians by 3rd Grade
In terms of 3rd grade, the demographic groups most similar to Scandinavians are Czech (98.4%, a difference of 0.0%), French Canadian (98.4%, a difference of 0.010%), European (98.4%, a difference of 0.010%), French (98.4%, a difference of 0.020%), and Chinese (98.4%, a difference of 0.020%).
| Demographics | Rating | Rank | 3rd Grade |
| Scotch-Irish | 100.0 /100 | #25 | Exceptional 98.5% |
| Aleuts | 100.0 /100 | #26 | Exceptional 98.5% |
| Croatians | 100.0 /100 | #27 | Exceptional 98.5% |
| French | 100.0 /100 | #28 | Exceptional 98.4% |
| French Canadians | 100.0 /100 | #29 | Exceptional 98.4% |
| Europeans | 100.0 /100 | #30 | Exceptional 98.4% |
| Czechs | 100.0 /100 | #31 | Exceptional 98.4% |
| Scandinavians | 100.0 /100 | #32 | Exceptional 98.4% |
| Chinese | 100.0 /100 | #33 | Exceptional 98.4% |
| Swiss | 100.0 /100 | #34 | Exceptional 98.4% |
| Arapaho | 100.0 /100 | #35 | Exceptional 98.4% |
| British | 99.9 /100 | #36 | Exceptional 98.4% |
| Italians | 99.9 /100 | #37 | Exceptional 98.4% |
| Chippewa | 99.9 /100 | #38 | Exceptional 98.4% |
| Latvians | 99.9 /100 | #39 | Exceptional 98.4% |